By Melanie Gárate, Climate Resiliency Manager and Amy Shen, Climate Resiliency Fellow
What did we do?
The Greater Boston Area is known for its cold winters, snowy city streets and Nor’Easter storms. We know to budget for salt on our roads, keep warm indoors and do the “penguin shuffle” to get to the car. Summers, however, are becoming increasingly important to plan for since they are getting longer, hotter, and more humid due to climate change. We need to understand how it impacts our built environment and the health of people in order to plan for it. Surprisingly, extreme heat, sometimes known as the “silent storm of extreme weather” causes more deaths in the US than all other weather hazards combined. As daily temperatures continue to increase in Massachusetts, MyRWA partnered with the Museum of Science, Boston (MOS) and the Resilient Mystic Collaborative (RMC) and launched Wicked Hot Mystic this summer with the incredible help of volunteer scientists! This work is supported by the City of Arlington and NOAA climate and funding from the Massachusetts Municipal Vulnerability Preparedness Program.
How did we do it?

Figure 1: Transects were mapped out in these 20 locations around the Mystic River Watershed (light blue area). Volunteers drove or biked these routes with temperature and air quality sensors to collect data for Wicked Hot Mystic.
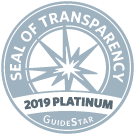
MyRWA and MOS conducted a heat mapping campaign to collect real-time ambient temperature data (the air we breathe and feel) and air quality (particulate matter 2.5 µm and smaller), in the Mystic River Watershed during a heat wave in August. Heat waves are at least 2-3 consecutive days of above 90ºF. Volunteer pairs drove through 17 pre-determined 1-hour transects at 6am, 3pm and 7pm on Thursday, August 12 and at 6am on Friday, August 18; cyclists biked 2 different transects during those same times (Figure 1). These volunteer scientists clipped a temperature sensor and air quality sensor to their car window. In total we had 80 people participate.
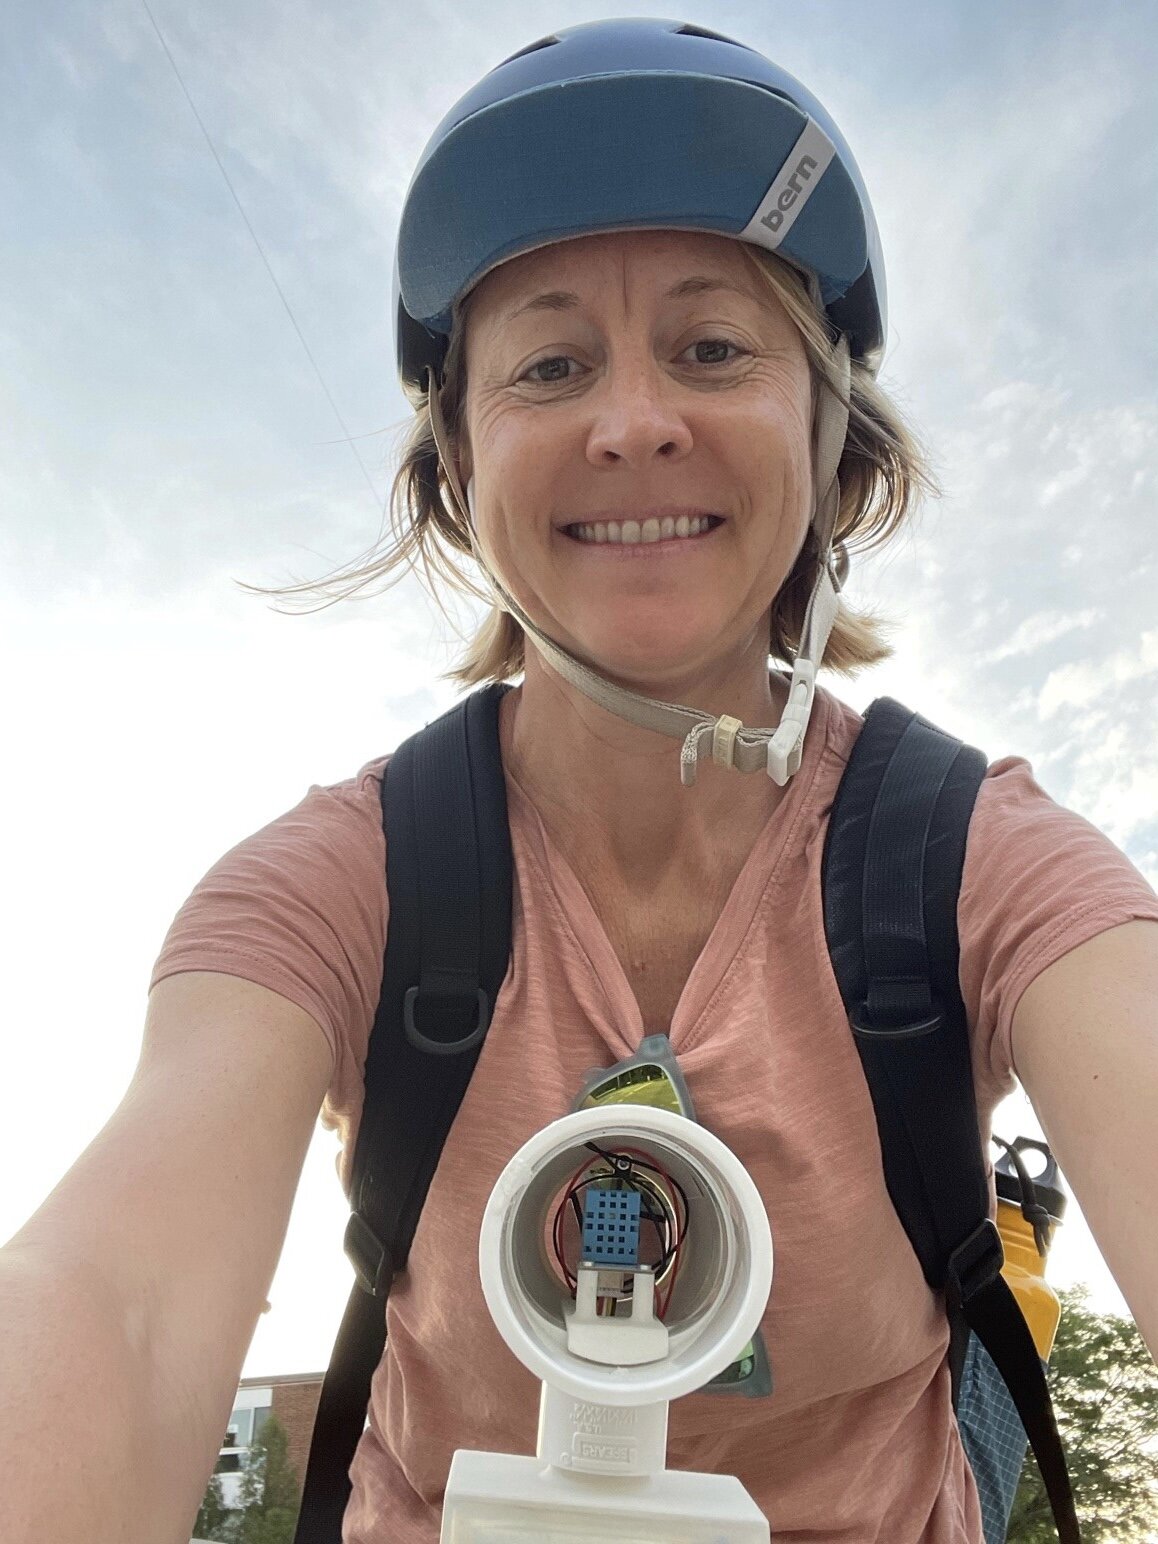
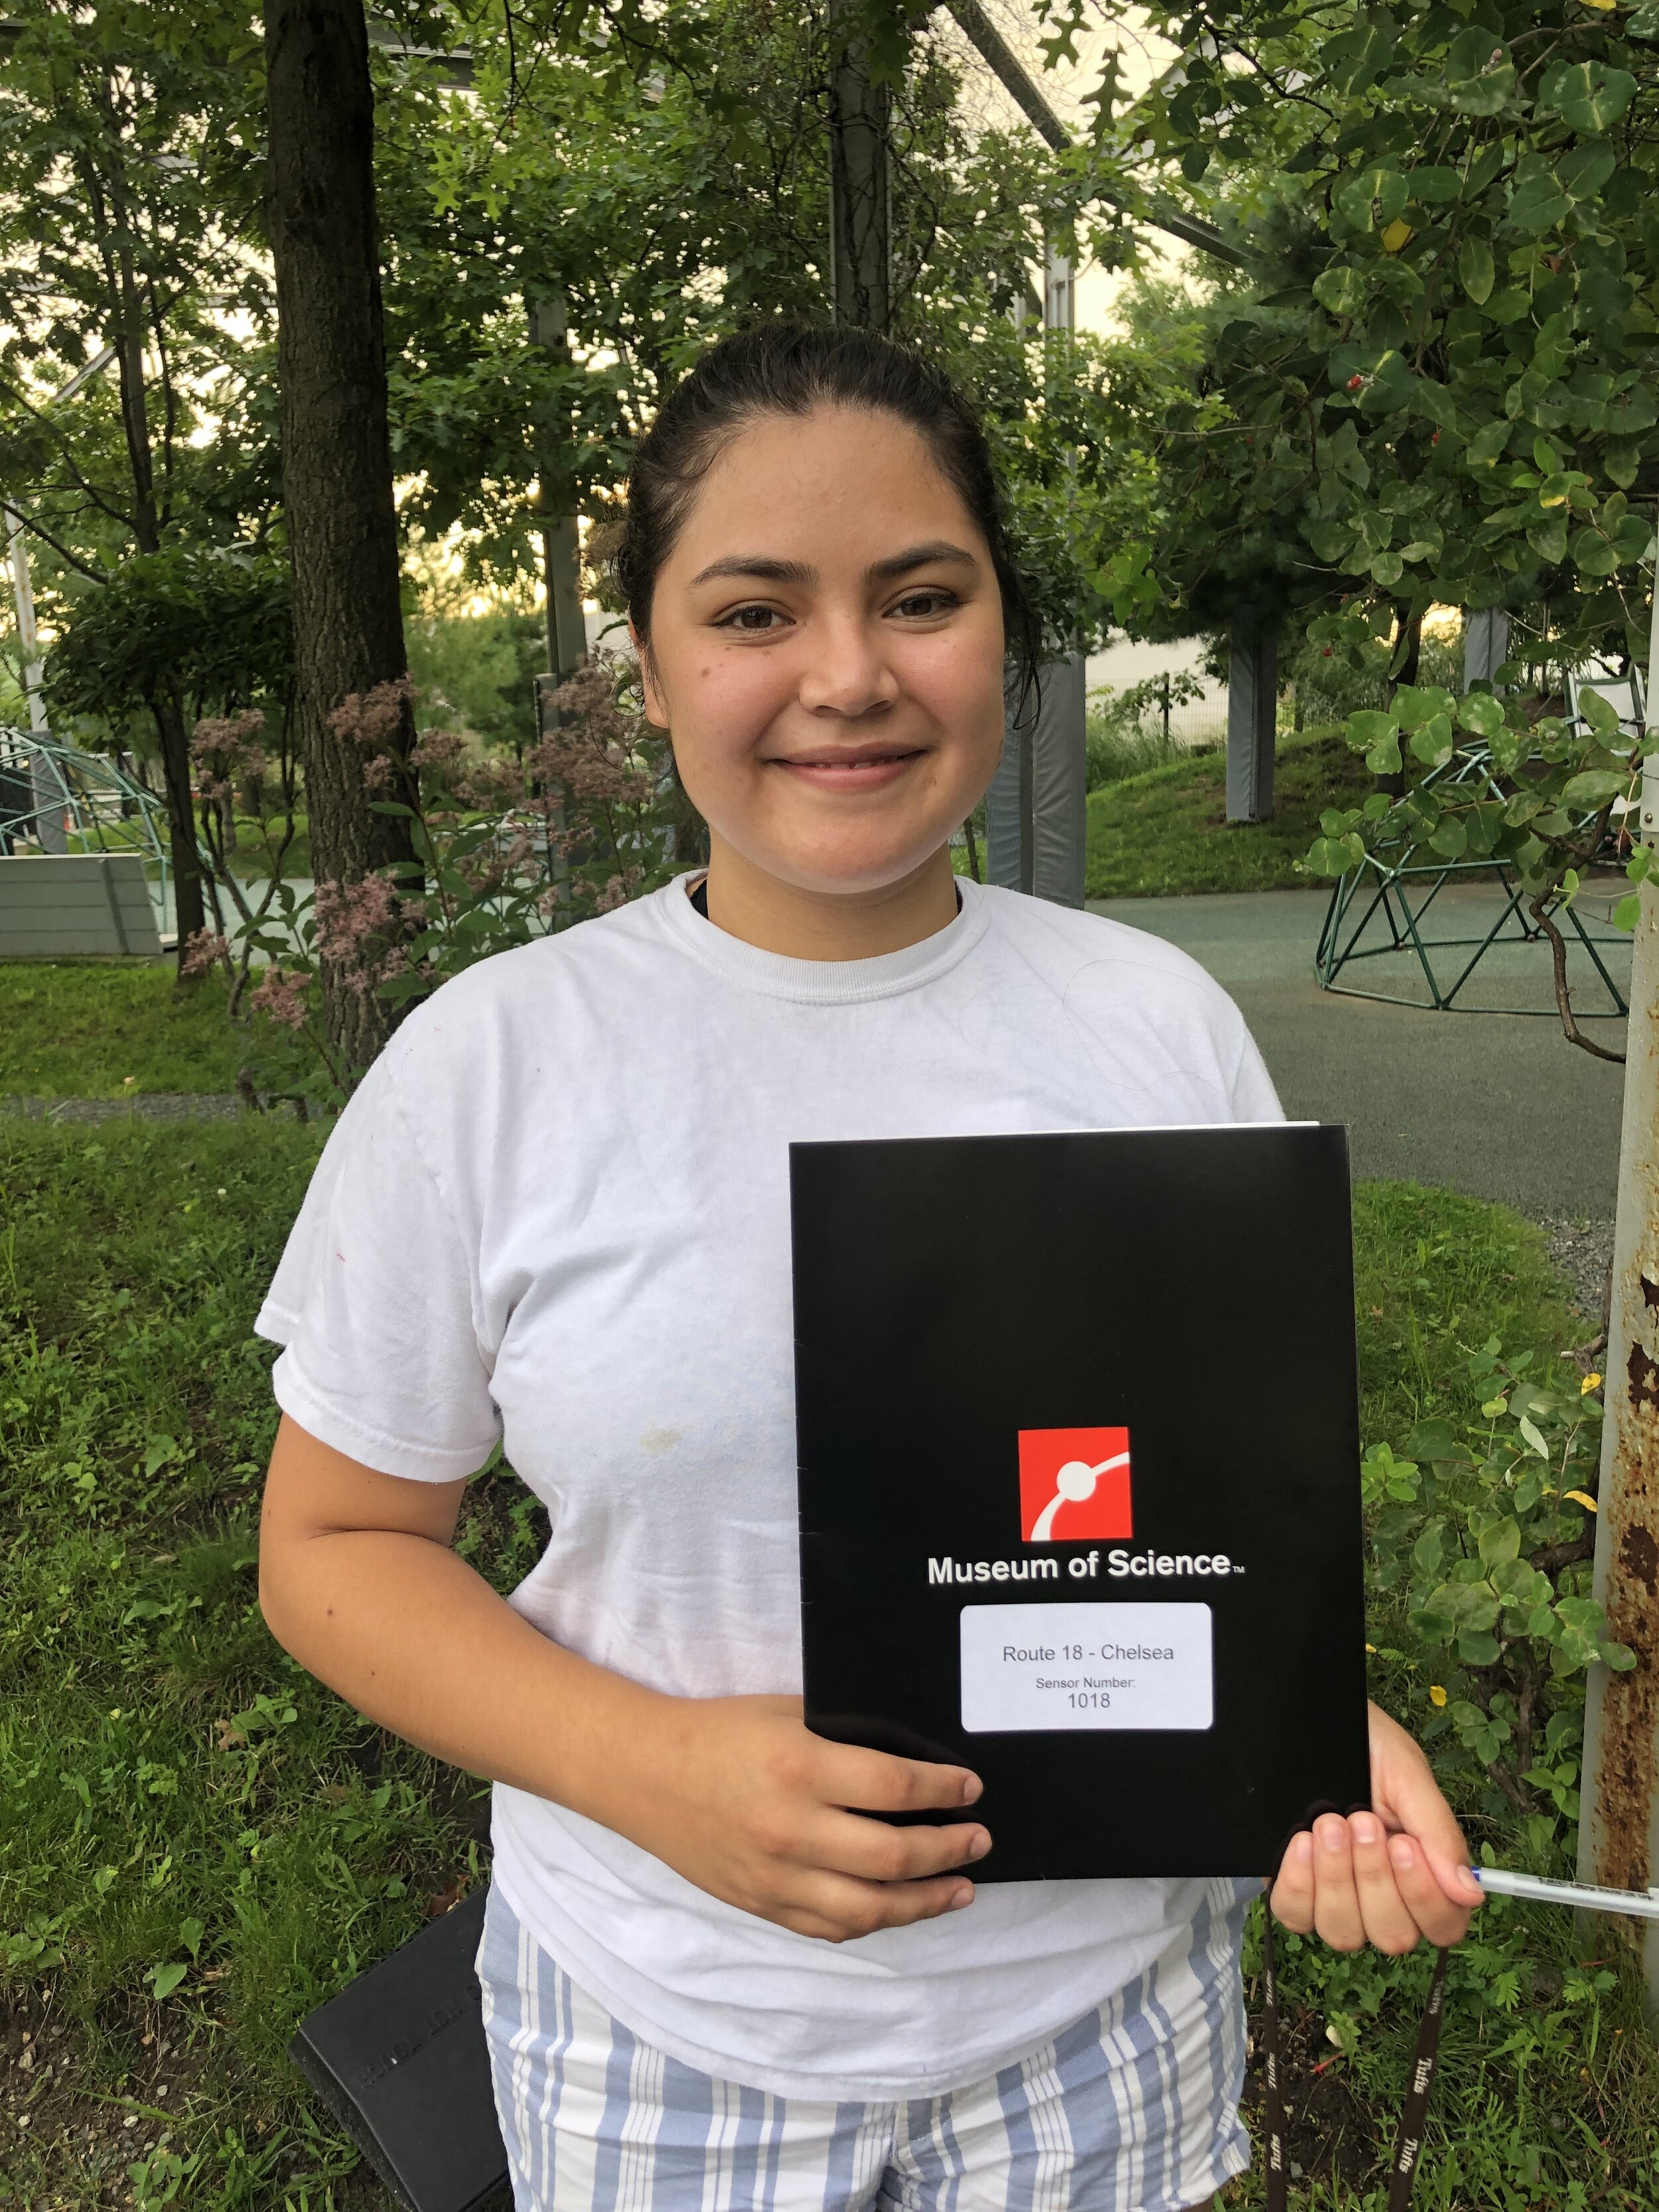
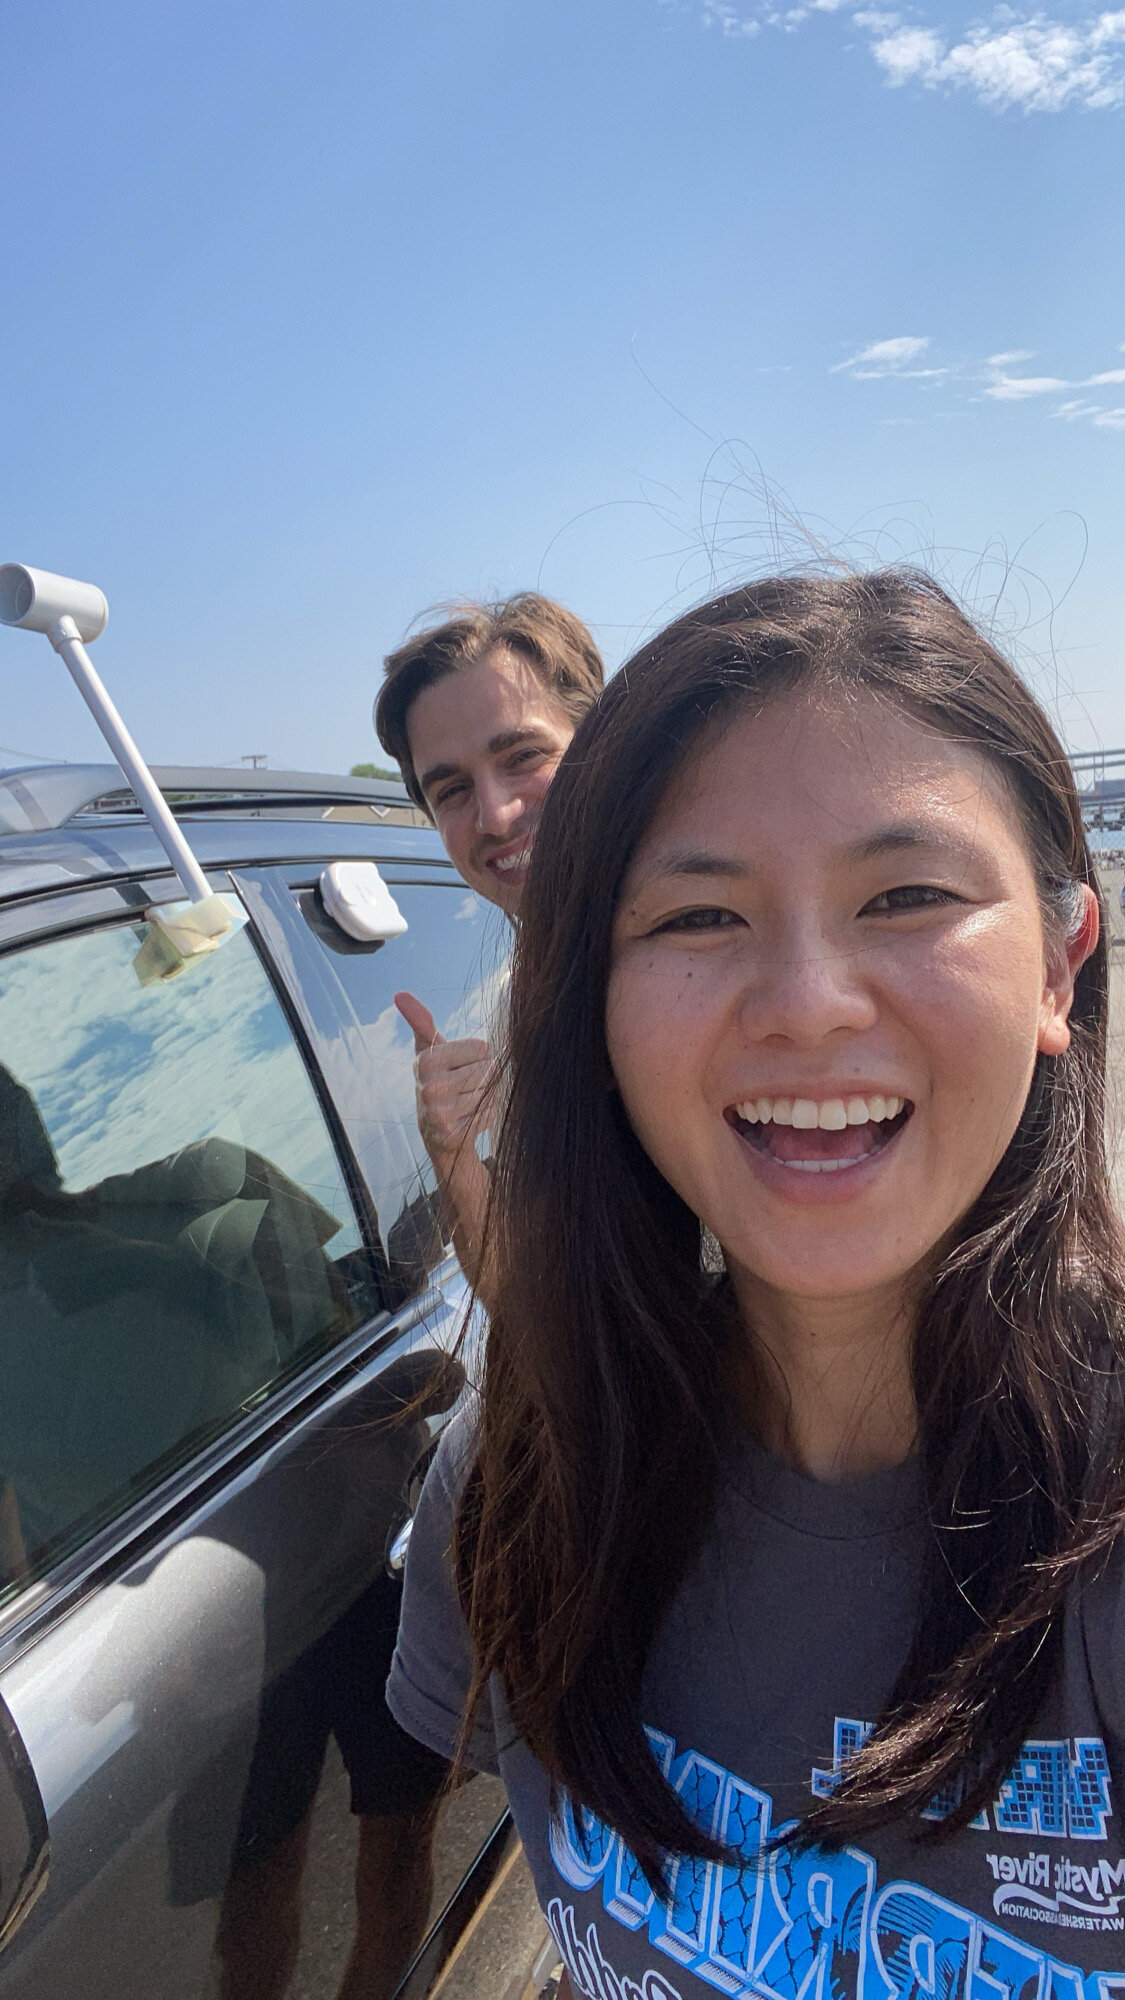
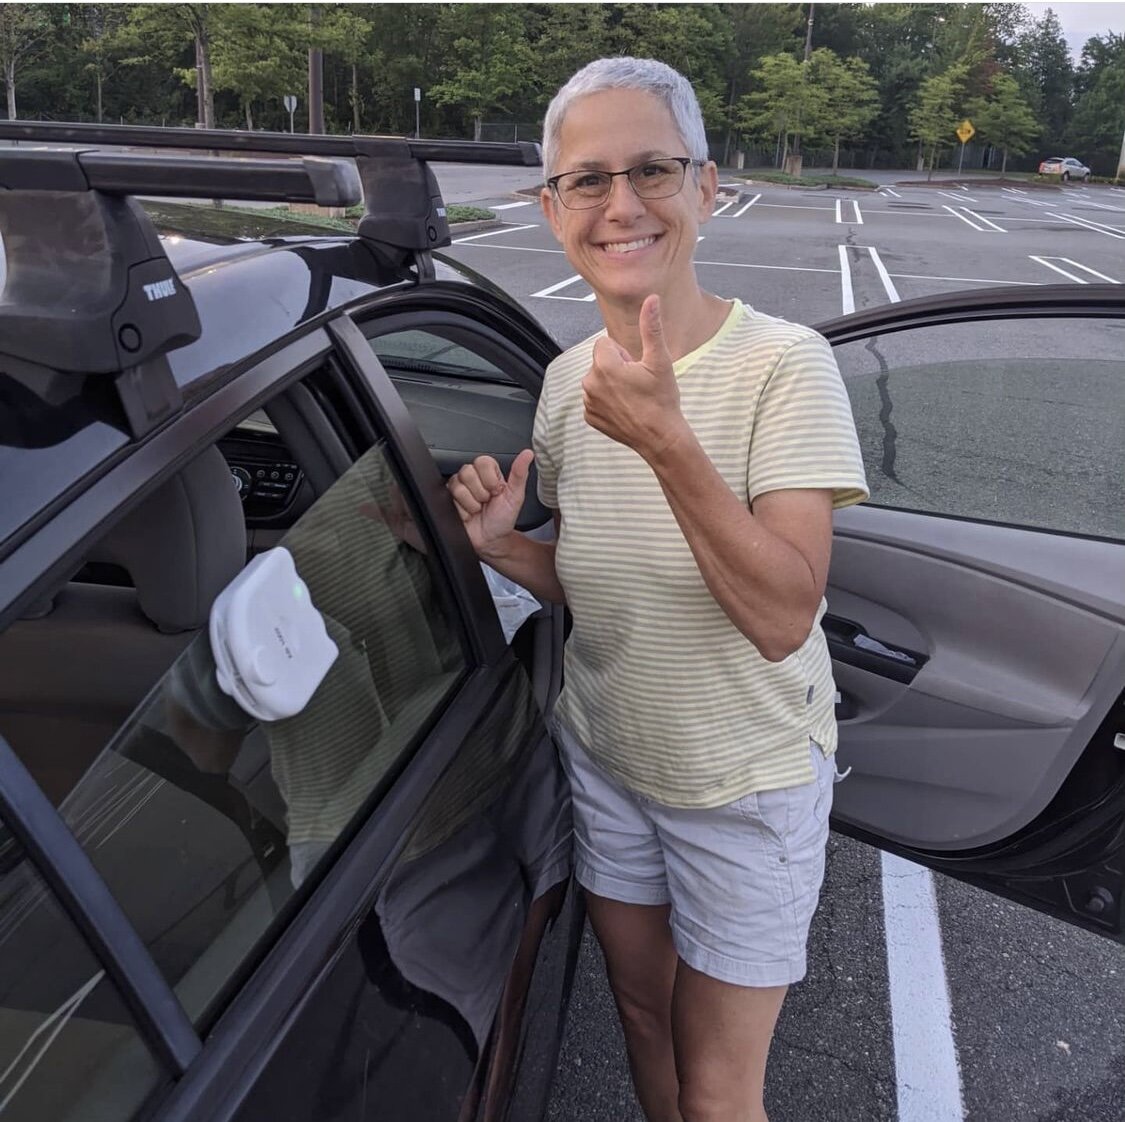
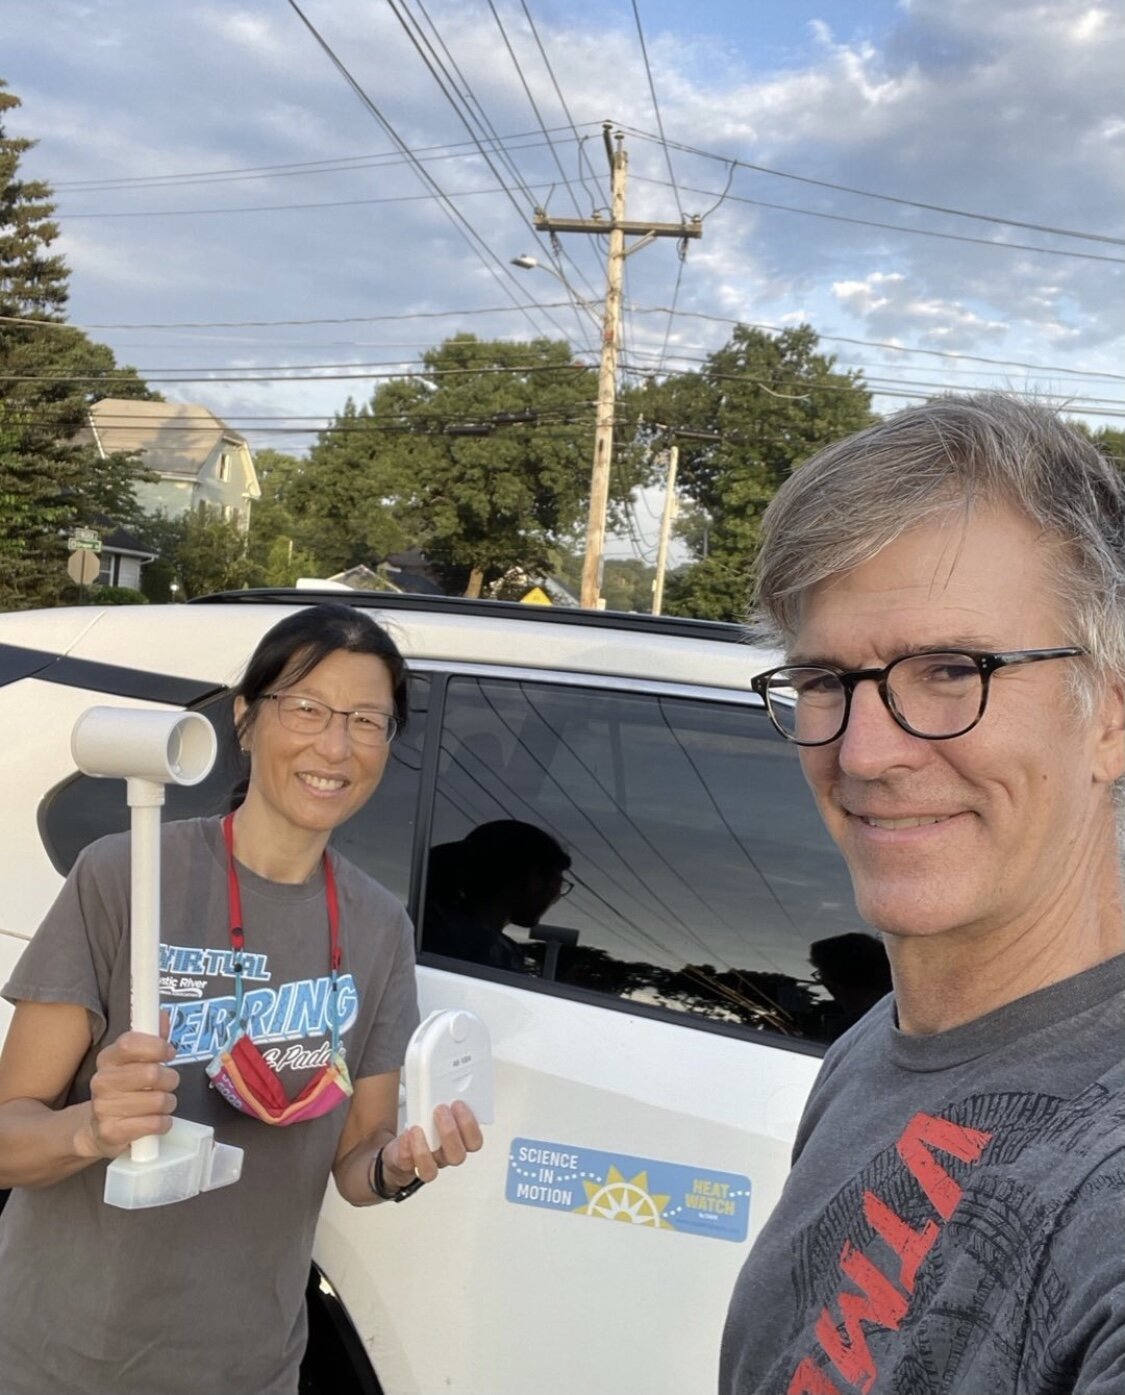
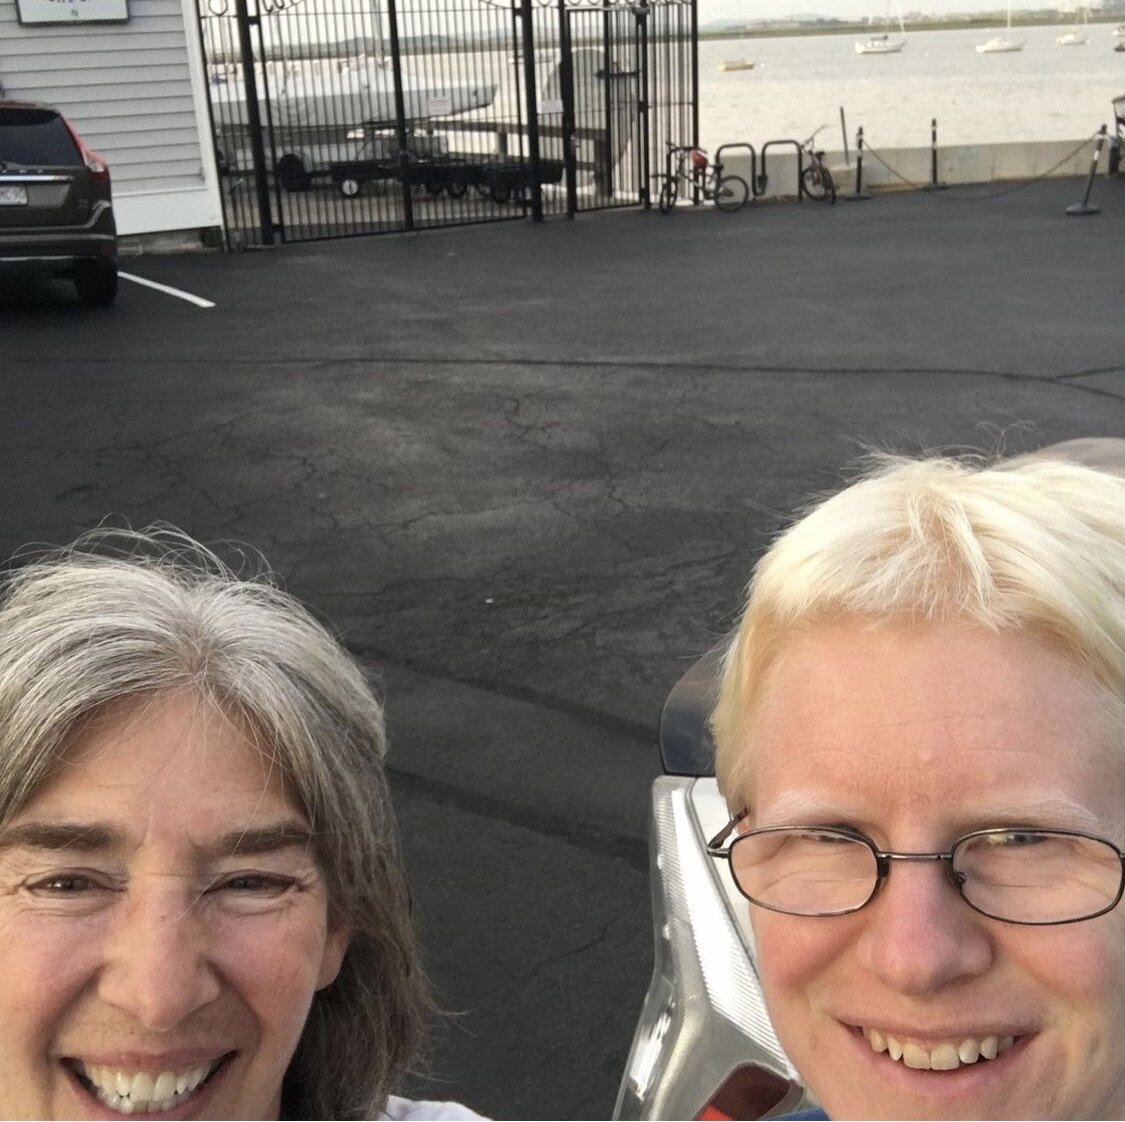
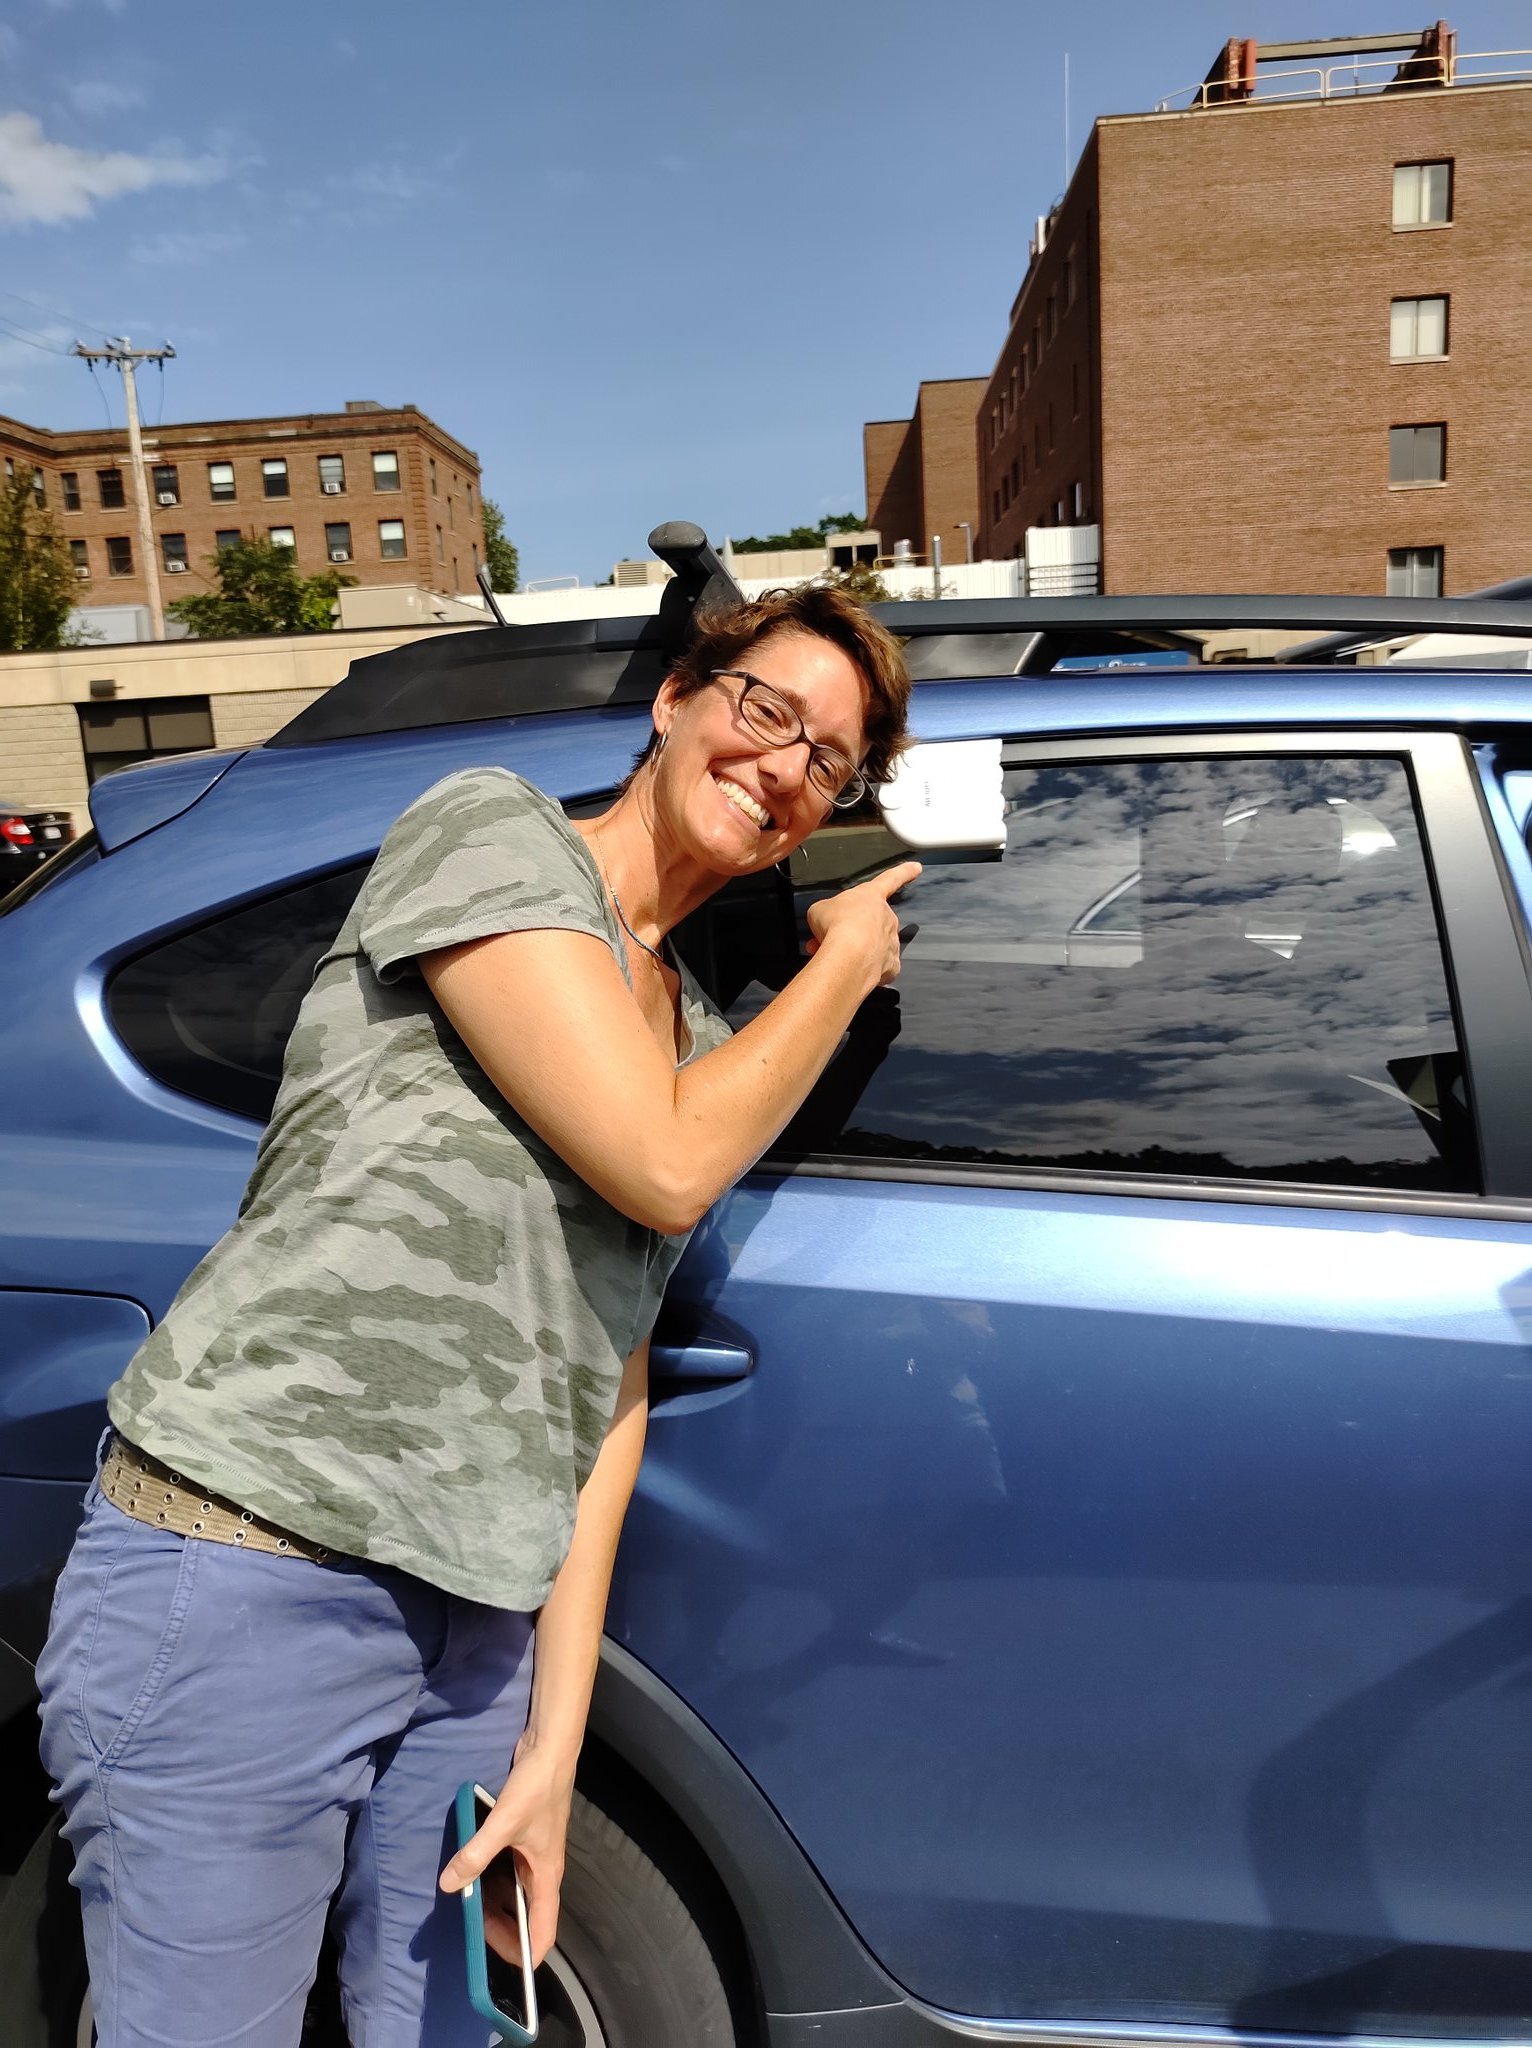
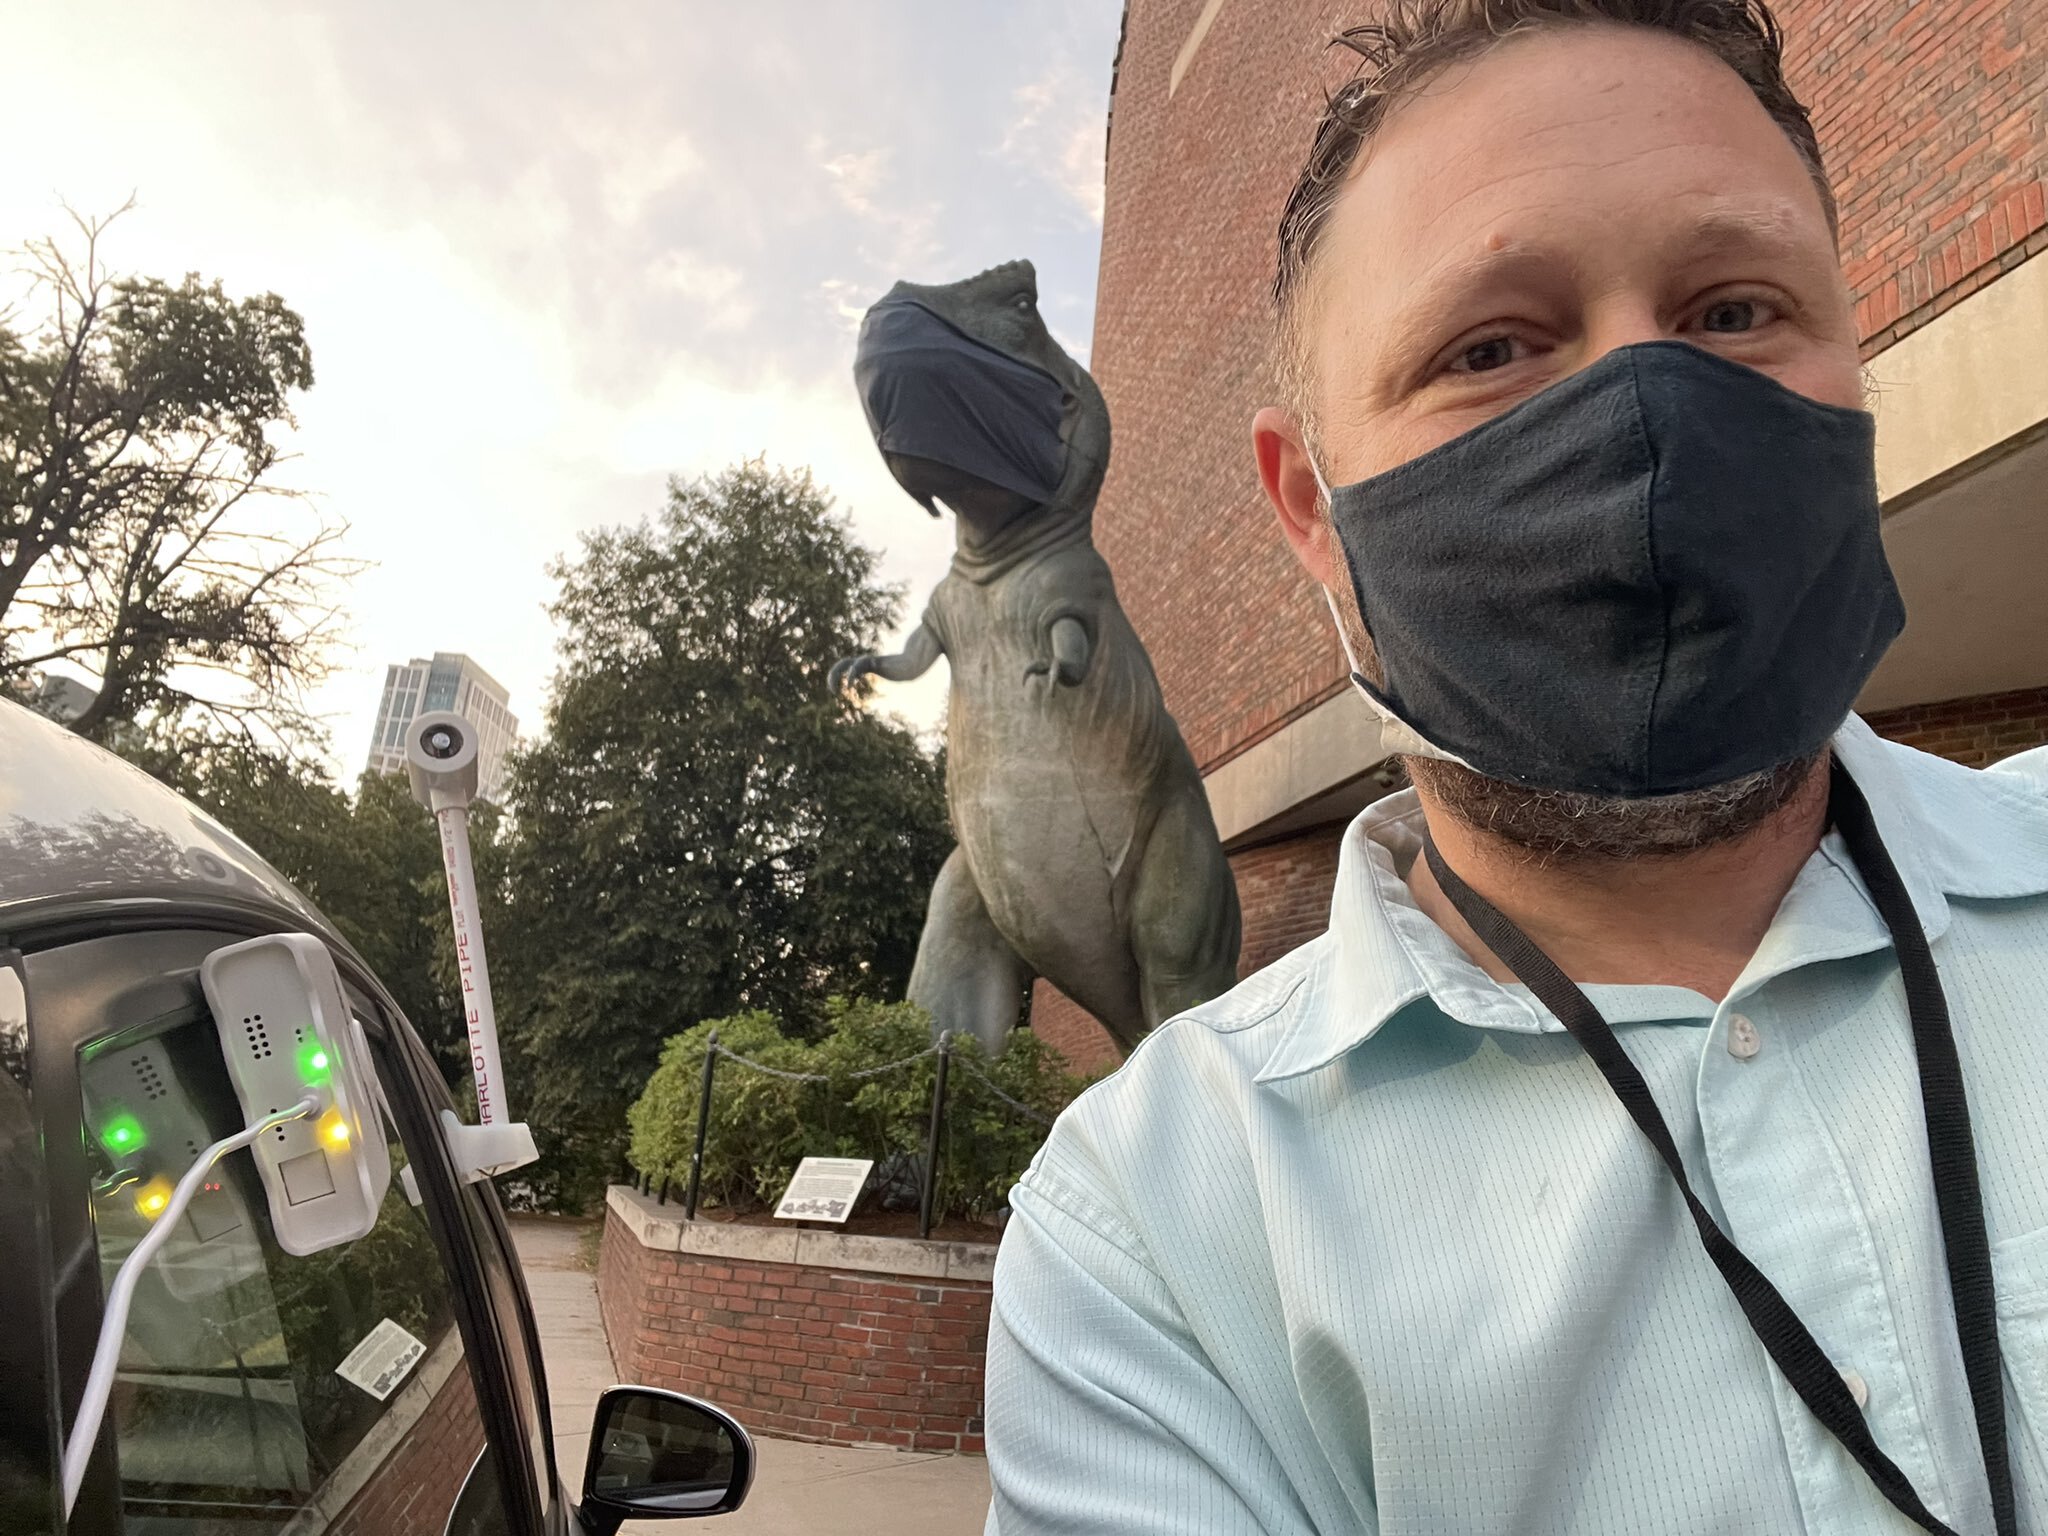
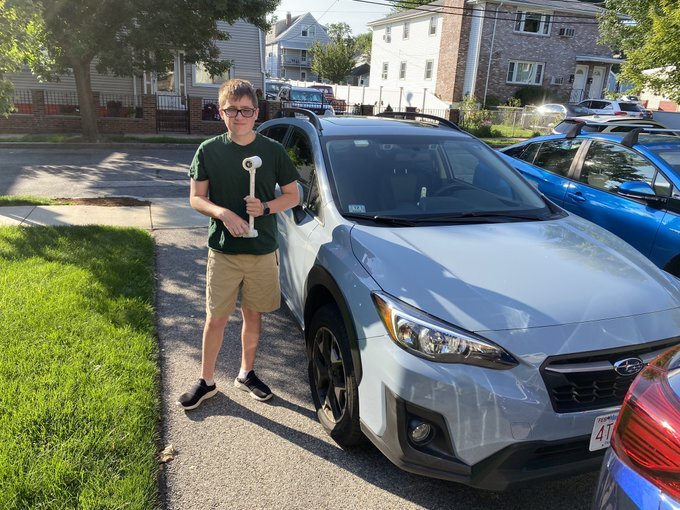
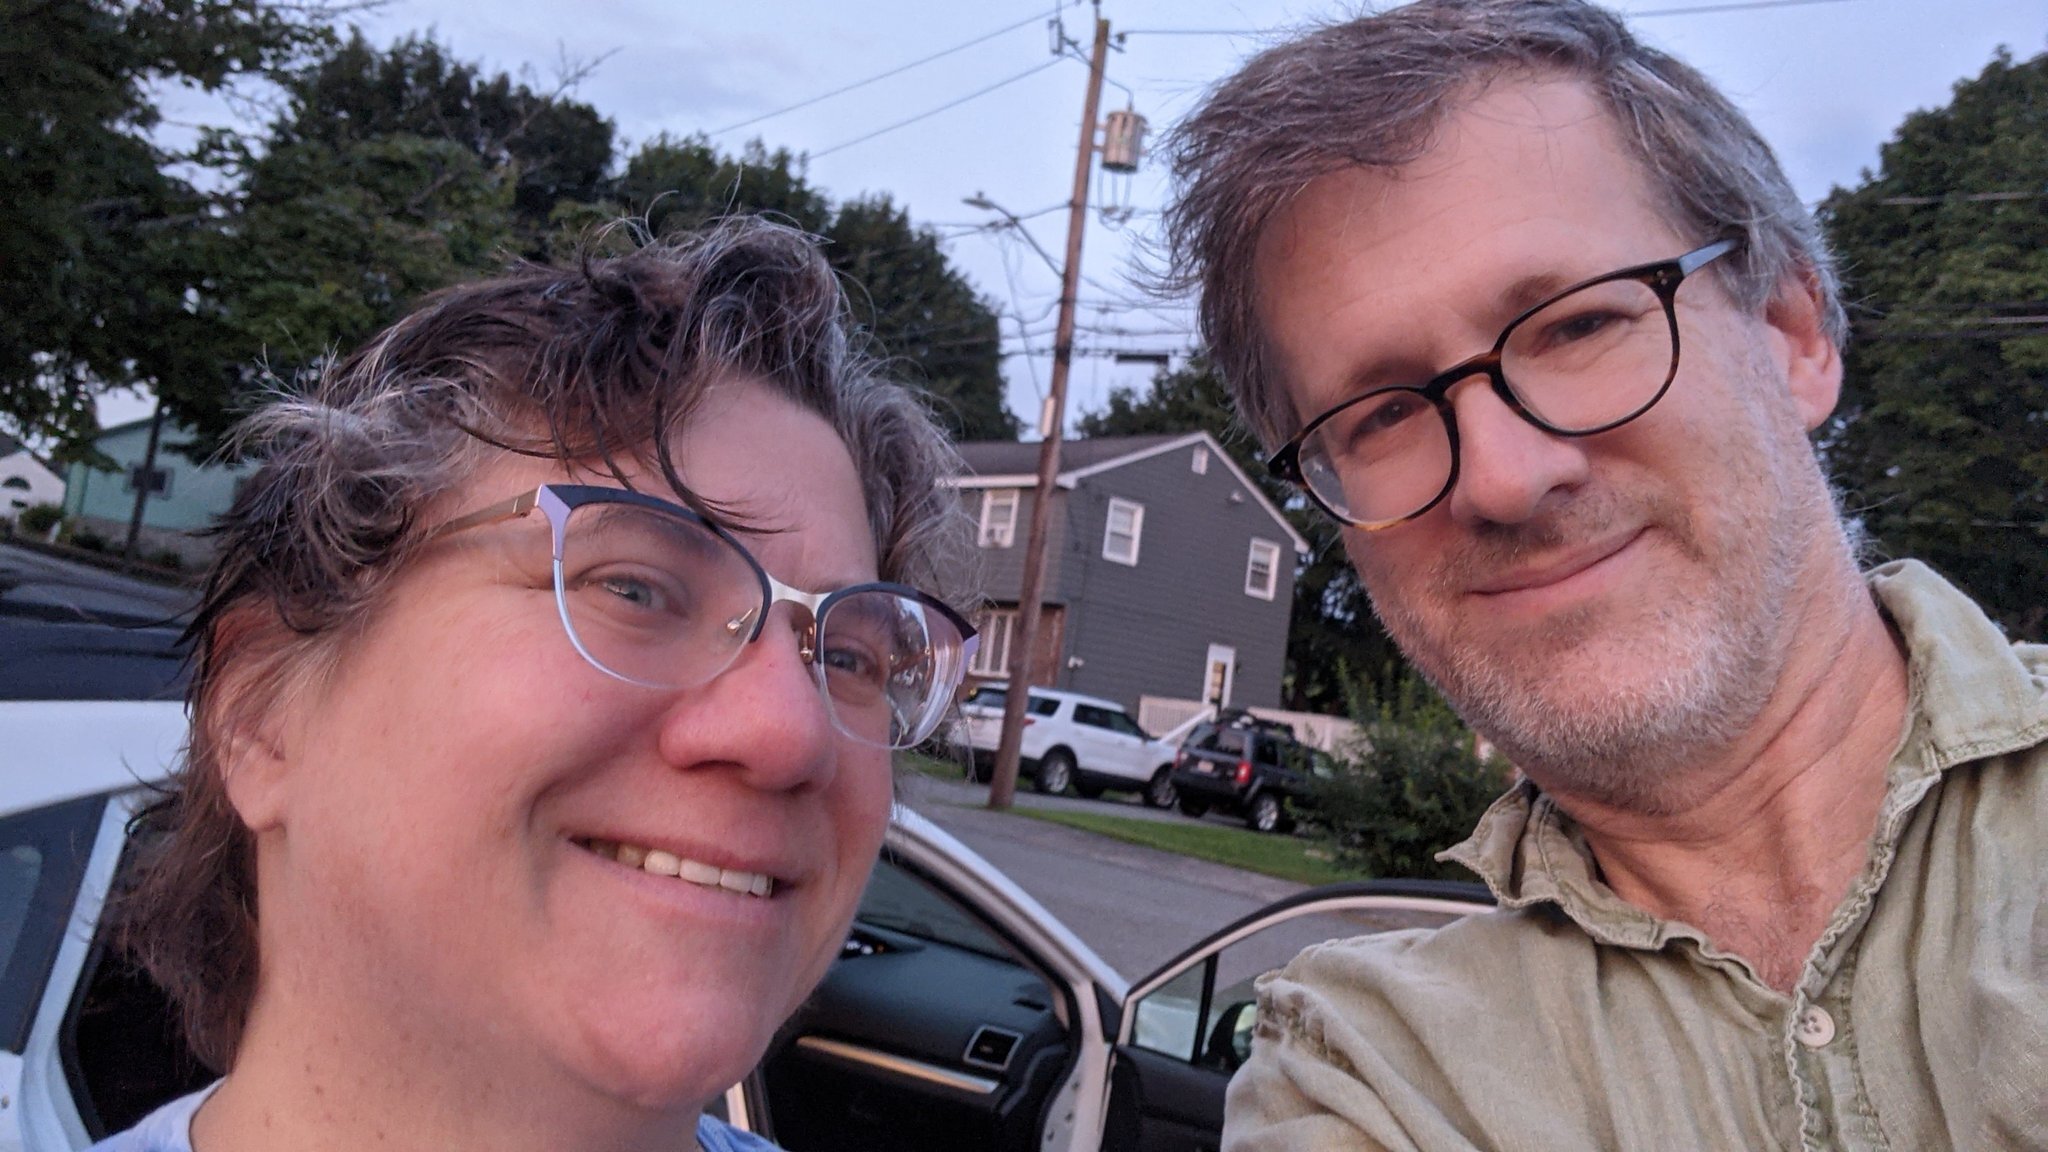
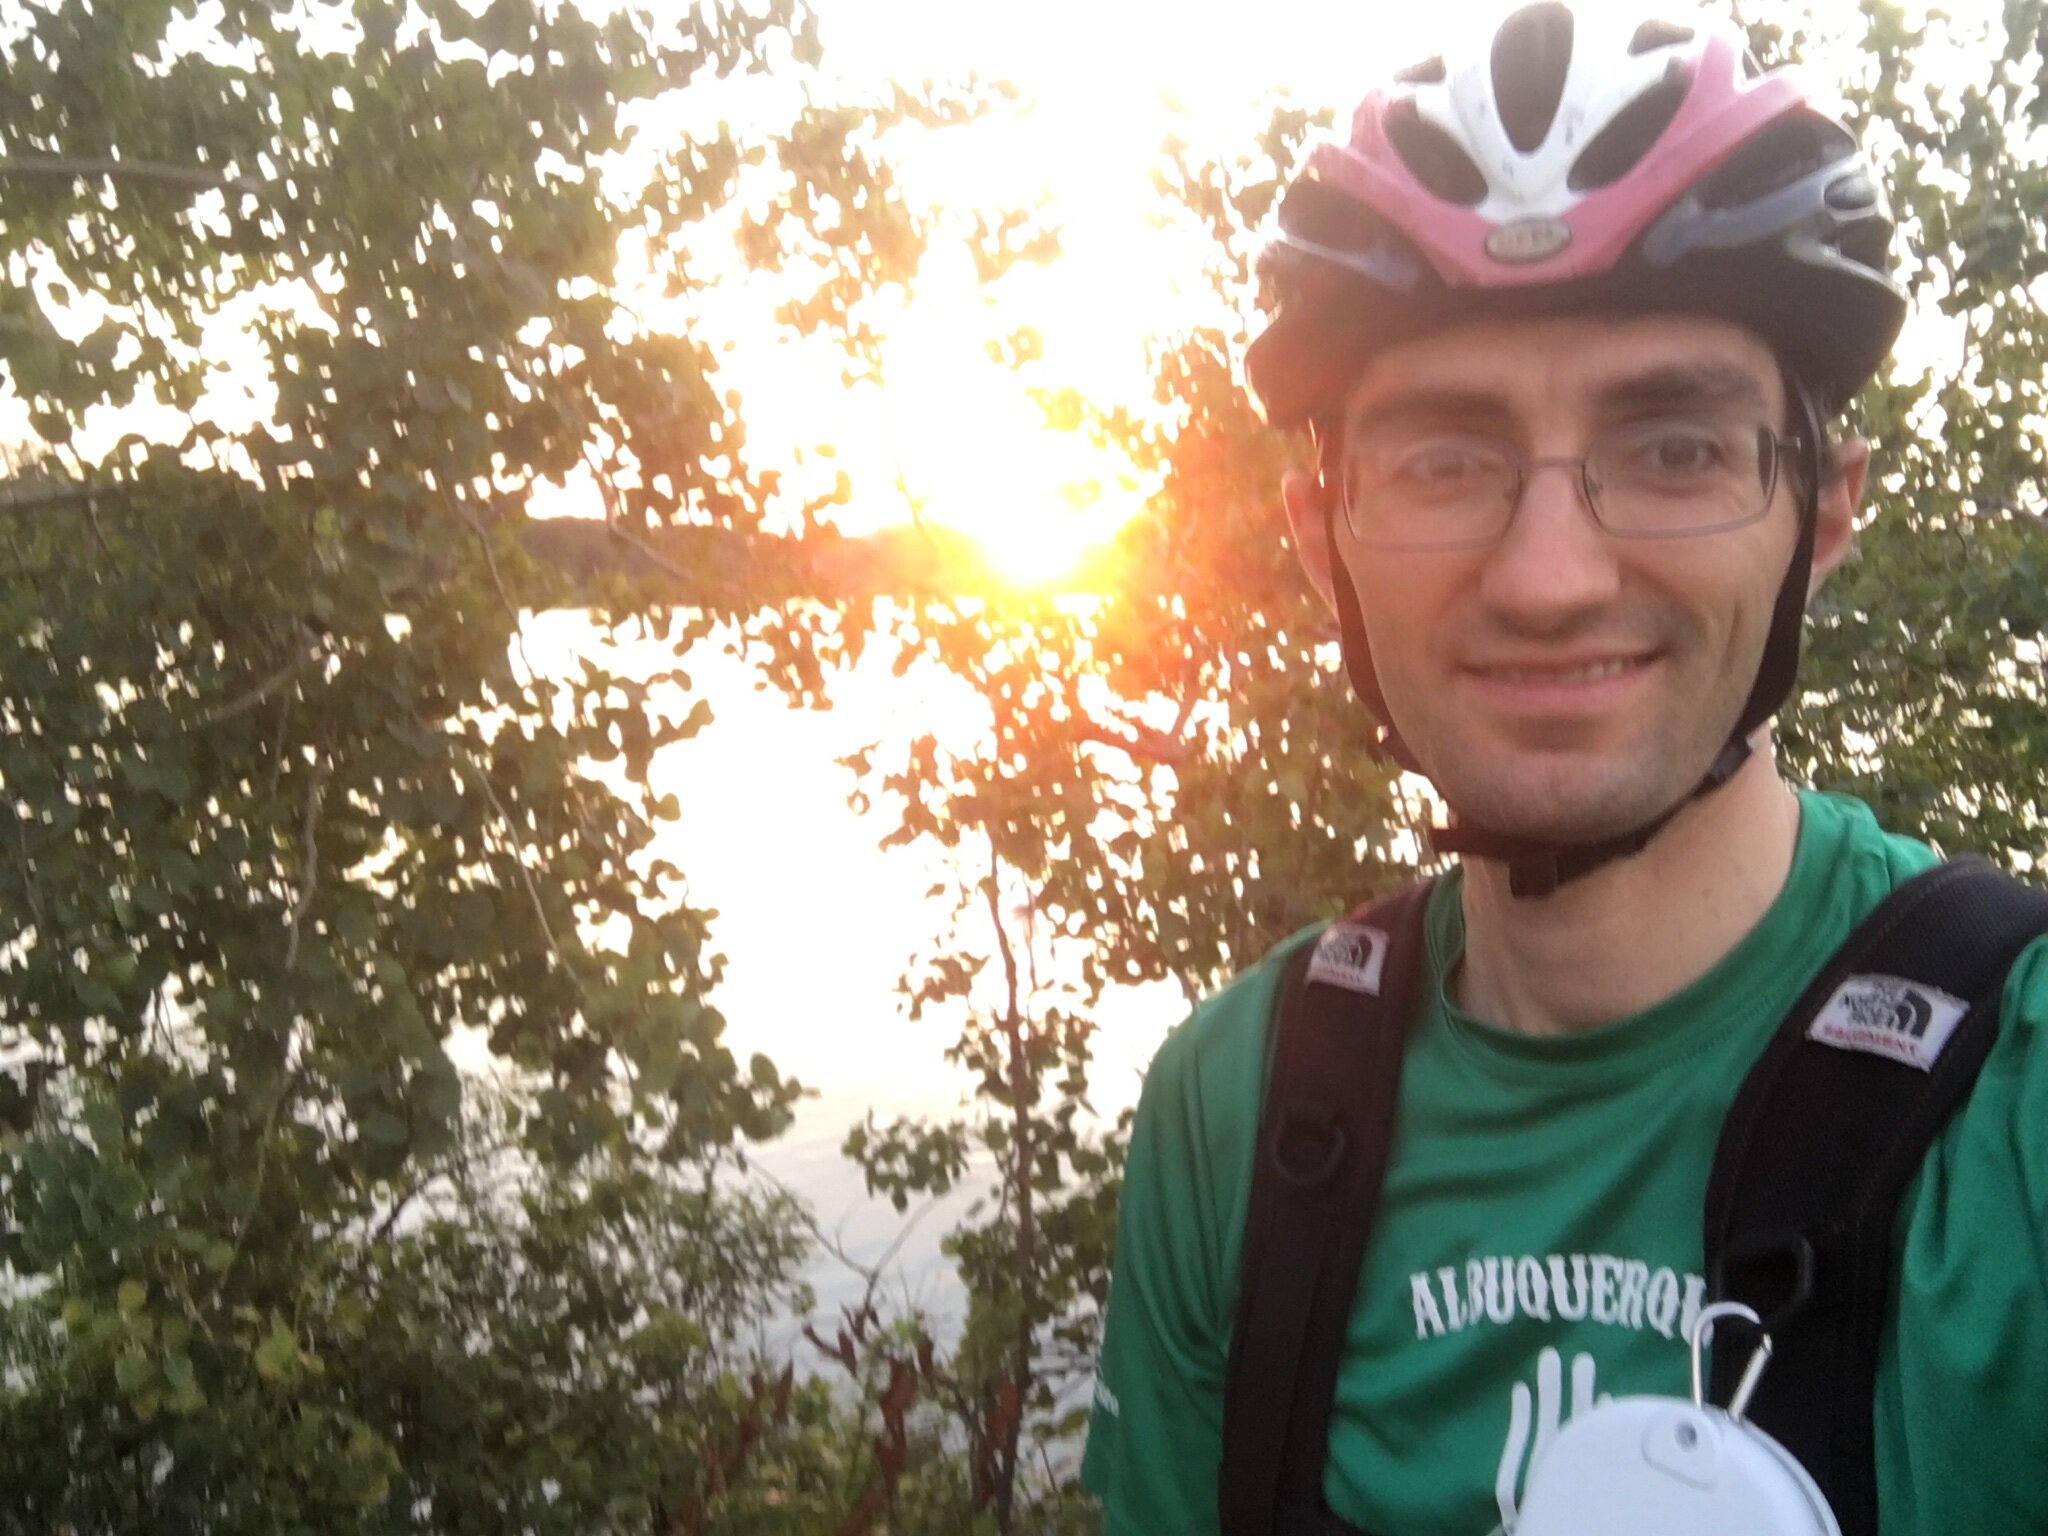
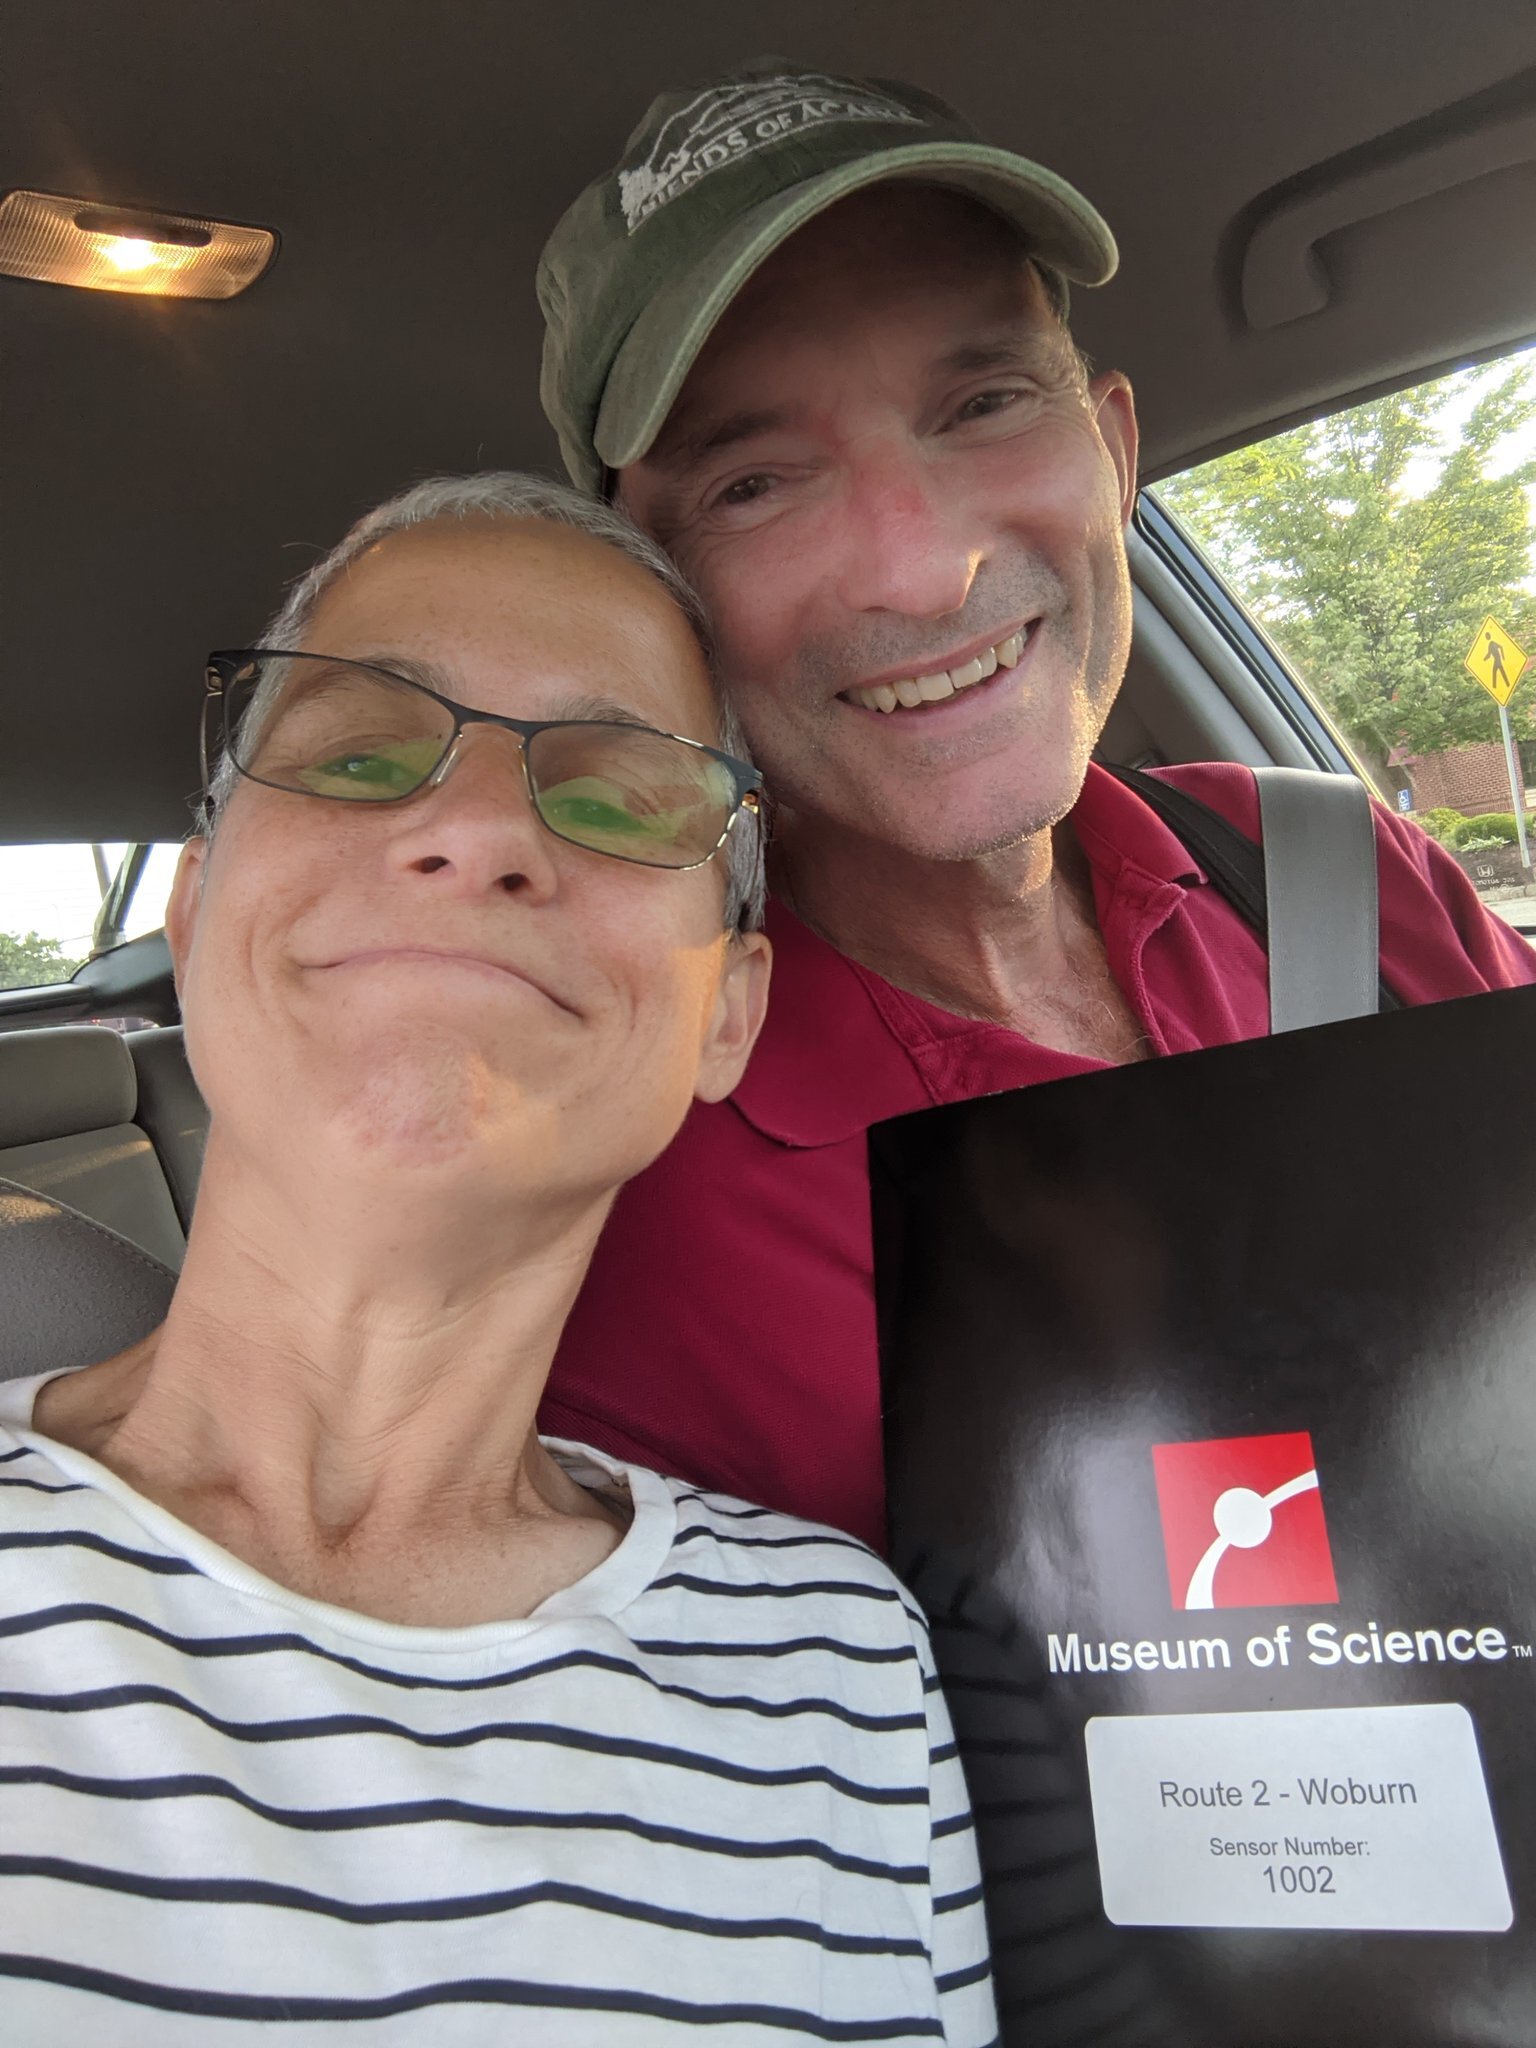
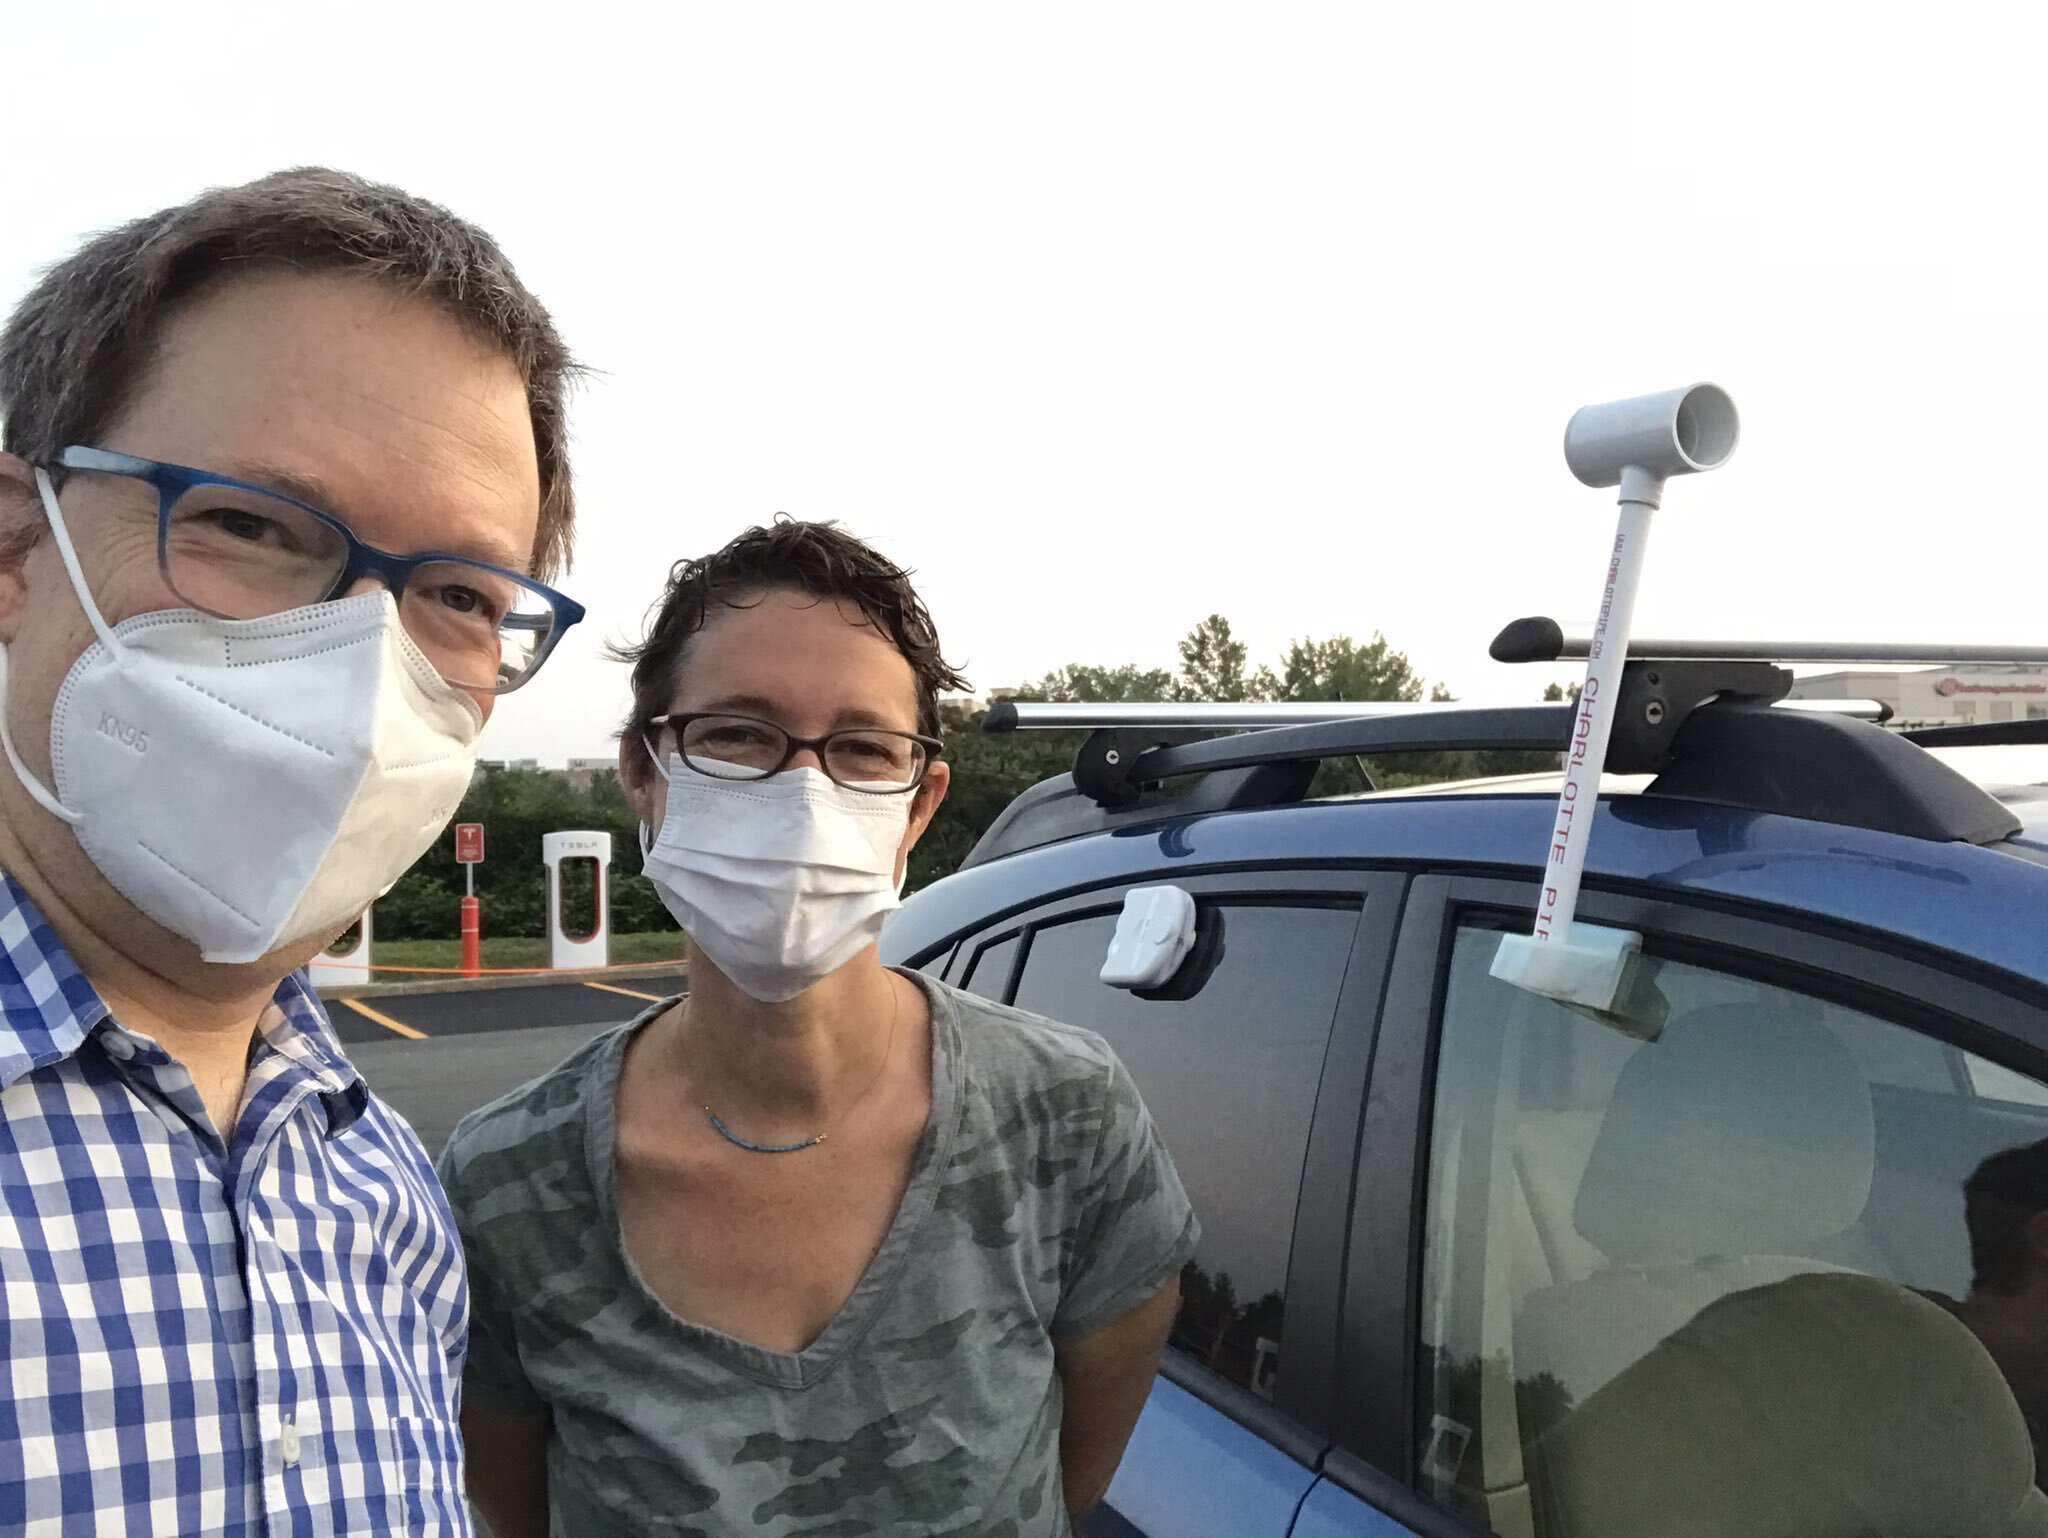
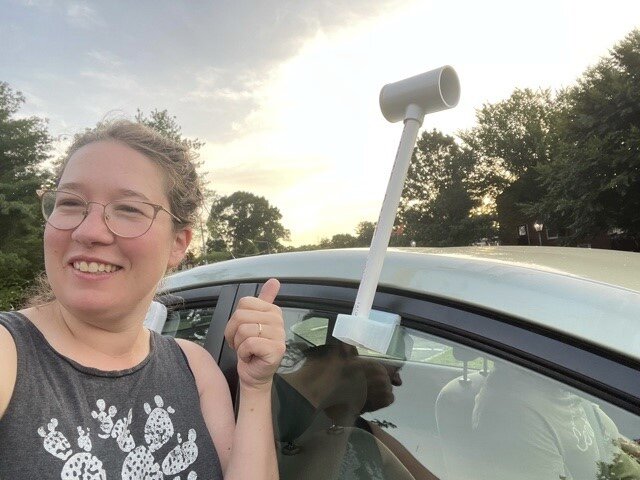
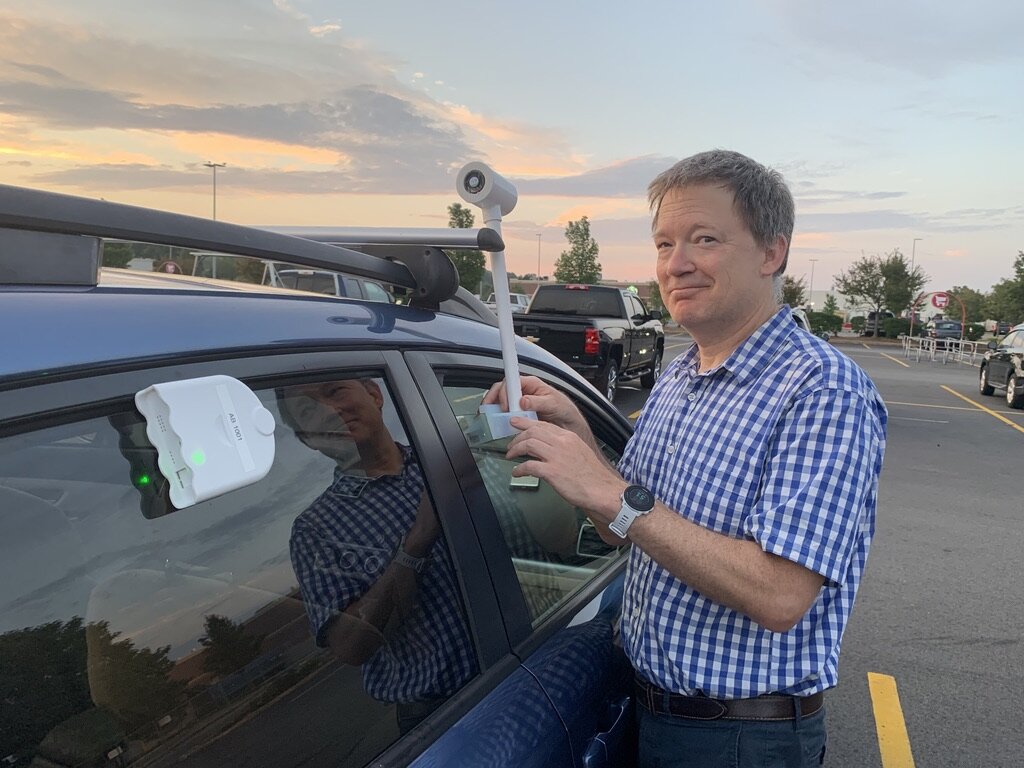
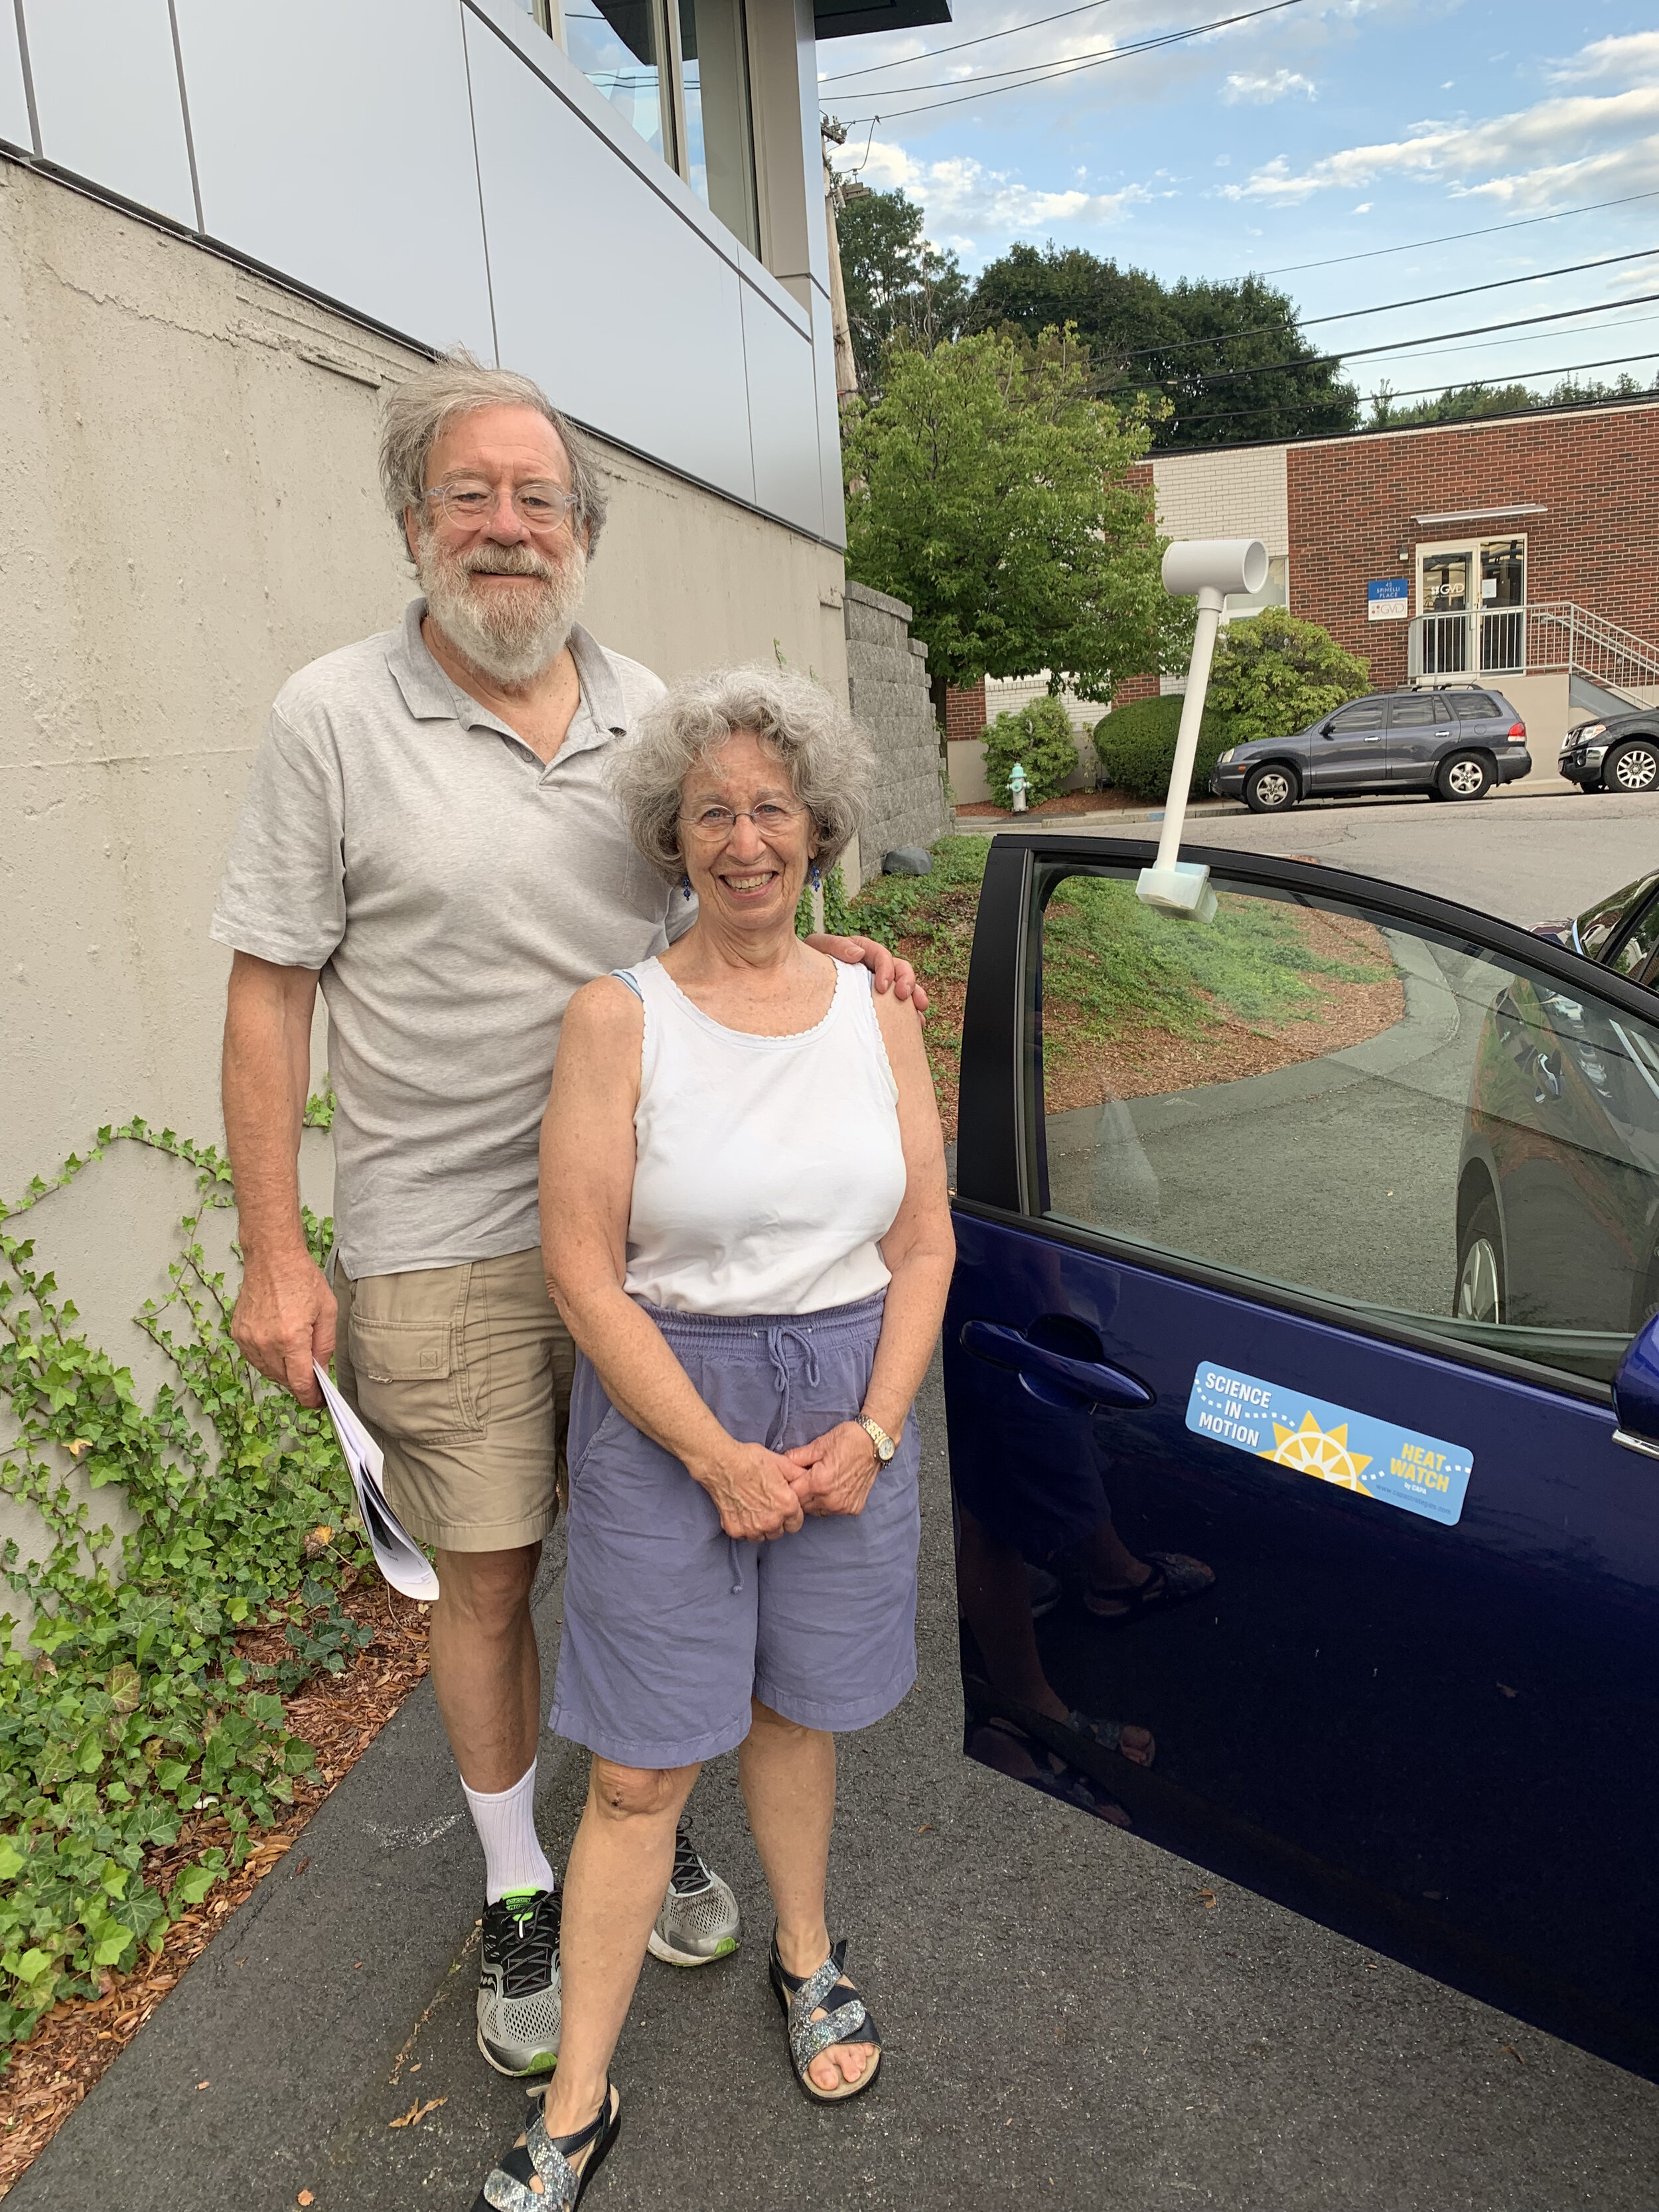
Scroll through these photos to see Wicked Hot Mystic in action! A HUGE thank you to all the Wicked Hot Mystic volunteers! PC: Allison Bland, Amber Christoffersen, Bob Paine, Rachel Weil, Melanie Gárate, David Sittenfeld, Julie Wormser, Patrick Herron, Daria Clark, Karen Ruiz Moreno, @dnki, and @DunbarCarpenter
Why is this important?
The results from this project will help us better understand where extreme heat and urban heat islands are within the watershed. These efforts will provide the cities with high resolution temperature data throughout the entire day and area, which can then be layered with other factors such as tree canopy, surface temperature, income level, elderly population, or emergency room visits. It is important to compare maps of extreme heat “hot spots” in the Boston area with maps of where people are in order to understand what neighborhoods and people are the most impacted.

Figure 2: Percent (%) of vegetated land cover (trees and shrubs) in the Mystic River watershed municipalities. Boston is represented by Charlestown and East Boston.
One important clue and chance for future extreme heat mitigation is quantifying tree cover in the watershed. Figures 2 and 3 show that the urban part of the watershed is predominantly low in tree cover. These areas are also the neighborhoods of environmental justice communities, namely low income and people of color who have been disproportionately impacted by environmental hazards, such as pollution and extreme weather. It is imperative that we create environmental and social infrastructure that prioritizes communities that are impacted first and worst; Wicked Hot Mystic is one step towards that goal for extreme heat in the Mystic River communities.

Figure 3: Percent (%) of vegetated land cover (trees and shrubs) in the Mystic River watershed municipalities. Boston is represented by Charlestown and East Boston.
What's next?
Stay tuned for the results of the Wicked Hot Mystic mapping campaign. We hope to host virtual and, if safe, in-person events to discuss data collected and work with the most impacted communities to build towards solutions.