Trash In the Mystic
Photo: MyRWA
Did you know that most of the plastic in the ocean comes from rivers? And that most of the plastic in rivers come off the land — much of it through the stormwater system?
Stormwater carries anything on the surface of our roads and sidewalks into rivers and streams. hat includes pollutants like oil, gas, detergents—and trash.
In other words, if you’re wondering where the trash in the river came from, look to the streets.
Virtual Trash Assessments
The Mystic River Watershed Association has been working to pinpoint more specifically the sources using a visual trash assessment (VTA)—a tool developed by the Environmental Protection Agency. This work was done with the support of 60 plus volunteers during three separate studies.
MyRWA conducted VTAs in 2018 and 2021 in Somerville and Medford, and a third VTA in 2022 in Everett. The results for all demonstrated that industrial, high-density multi-family residential, and commercial areas had far more trash than residential neighborhoods. Open spaces such as cemeteries, forests, and open lands had the least trash. We can use this data to advise municipalities on where the best bang-for-the-buck would be in terms of management practices—from increased street cleaning, to more trash cans, to outreach to local businesses and residents. As many of the high-density neighborhoods are also in environmental justice communities—we can also draw attention to this inequity.
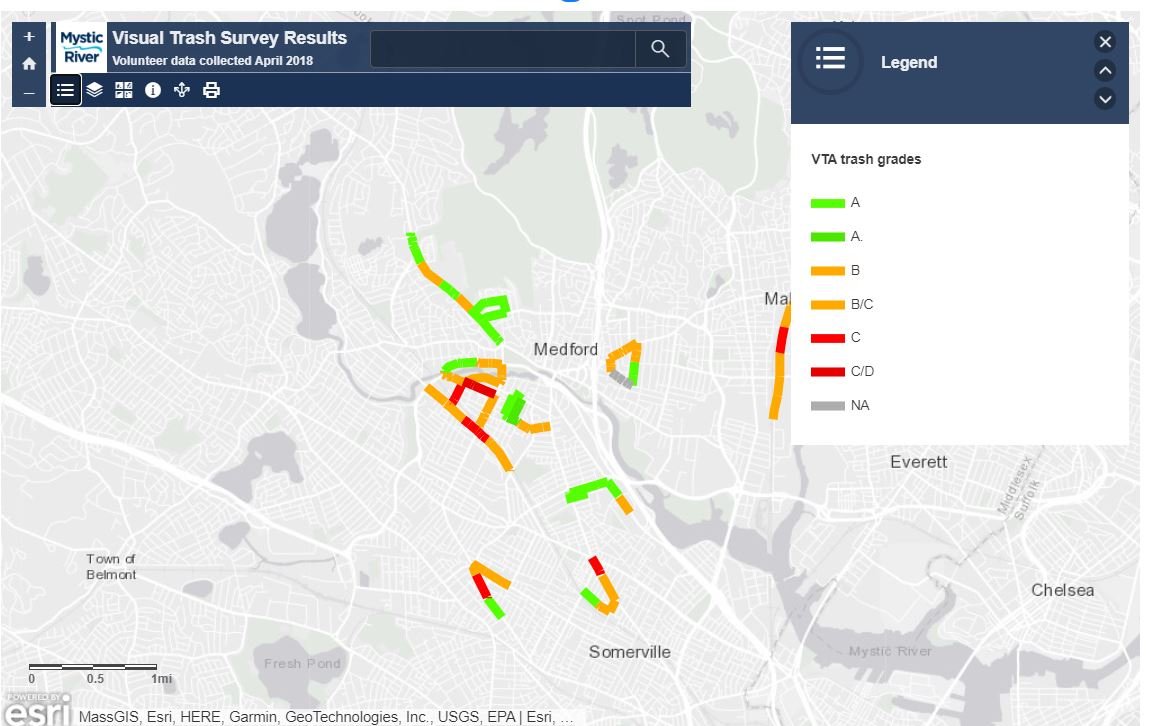
The maps (Figure 1, 2 and 3) show how the participants rated given streets and paths for amount of trash, using protocols defined by EPA. (Lower grades represent more trash.) Next, we overlaid this trash data with land-use data to determine what kinds of landscapes contribute the most trash. Each path in the map was assigned to a category. Then we averaged the grades for all segments within each land-use type, weighted by distance.
Figure 1. 2018 Trash Grades in Somerville & Medford
Table 1. 2018 trash grades by land-use type
Figure 2. 2021 Trash Grades in Somerville & Medford2
Table. 2018 trash grades by land-use type
For the 2022 Everett VTA the team surveyed a total of 104 segments (Figure 3). For this study, the team also marked the sites of public trash cans.. Out of 104 segments that were surveyed only 16 segments had trash cans; and what we found was that there were less trash on those streets.
Figure 3: 2022 Trash Grades in Everett
In as separate study, on Earth Day 2018, we set out with 50 volunteers to collect, categorize and remove trash from Torbert Macdonald Park in Medford. In just over an hour, we were able to collect almost 80 pounds of trash! Thanks to our dedicated volunteers, we counted and categorized half of this trash. We broke the trash into almost forty categories; first based on material (paper, glass, metal, plastic and other), and then further into uses such as water bottles, food packaging, cigarettes, etc. Overall, our volunteers counted almost 2,000 discrete trash items. Below is a breakdown of some of the interesting finds.
The most abundant items:
463 small fragments (we asked volunteers to remove even small pieces of trash)
238 cigarettes
193 plastic bags
161 Styrofoam food packaging items (mostly Dunkin’ Donuts and Seven Eleven)
128 plastic food wrappers
148 plastic beverage/water bottles
105 paper fragments
40 glass bottles
36 straws
35 bottle caps
34 cans
27 candy wrappers
Over 20 fast food paper items like cups and napkins—mostly from Dunkin’ Donuts
Unique items collected:
Parking ticket
Homework
Fake plant
Traffic cone and bricks
Plastic was the predominant material found. Food and drink-related plastic was most common. Neither result is surprising, perhaps, but it will help us in our efforts to inform the public and inform management practices.
All of the data collected in these events and others will be used to gain a better understanding of where river trash is coming from within the watershed, allowing us to develop location-specific plans to prevent future trash from entering the Mystic River.


